使用 Kafka 和 ELK 搭建测试日志系统(1)
本文仅供自己学习,不合适转载。
这是两篇文章的第一部分。
1. 安装 ELK
1.1 安装 ElasticSearch
在海航云上创建一个 Ubutu 16.4 虚机,2核4GB内存。
(1)执行以下命令,更新系统
sudo apt-get update -y
sudo apt-get upgrade -y
(2)安装 Java
sudo add-apt-repository -y ppa:webupd8team/java
sudo apt-get update
sudo apt-get install oracle-java8-installer -y
(3)安装ES
wget https://artifacts.elastic.co/downloads/elasticsearch/elasticsearch-5.2.2.deb
sudo dpkg -i elasticsearch-5.2.2.deb
修改/etc/elasticsearch/elasticsearch.yml:
- 将 network.host 修改为本机 ip 即 192.168.10.102
- 将 http.port 修改为 9200
- 将 cluster.name 修改为 elk-test
重启 ES并检查服务状态:
root@elk:/home/ubuntu# service elasticsearch restart
root@elk:/home/ubuntu# service elasticsearch status
● elasticsearch.service - Elasticsearch
   Loaded: loaded (/usr/lib/systemd/system/elasticsearch.service; disabled; vendor preset: enab
   Active: active (running) since Sat 2017-09-30 11:23:17 CST; 3s ago
     Docs: http://www.elastic.co
  Process: 3861 ExecStartPre=/usr/share/elasticsearch/bin/elasticsearch-systemd-pre-exec (code=
 Main PID: 3864 (java)
    Tasks: 15
   Memory: 2.1G
      CPU: 4.511s
1.2 安装 Nginx 和 Logstash
创建另一台虚机,安装 Nginx 和 Logstash。
1.2.1 安装 Nginx
apt-get install nginx
Ubuntu安装之后的文件结构大致为:
- 所有的配置文件都在/etc/nginx下,并且每个虚拟主机已经安排在了/etc/nginx/sites-available下
- 程序文件在/usr/sbin/nginx
- 日志放在了/var/log/nginx中
- 并已经在/etc/init.d/下创建了启动脚本nginx
- 默认的虚拟主机的目录设置在了/var/www/nginx-default (有的版本 默认的虚拟主机的目录设置在了/var/www, 请参考/etc/nginx/sites-available里的配置)
启动并查看服务状态:
root@elk:/home/ubuntu# /etc/init.d/nginx start
[ ok ] Starting nginx (via systemctl): nginx.service.
root@elk:/home/ubuntu# /etc/init.d/nginx status
● nginx.service - A high performance web server and a reverse proxy server
   Loaded: loaded (/lib/systemd/system/nginx.service; enabled; vendor preset: enabled)
   Active: active (running) since Sat 2017-09-30 11:40:59 CST; 1min 8s ago
 Main PID: 4320 (nginx)
   CGroup: /system.slice/nginx.service
           ├─4320 nginx: master process /usr/sbin/nginx -g daemon on; master_process on;
           ├─4321 nginx: worker process
           └─4322 nginx: worker process

Sep 30 11:40:59 elk systemd[1]: Starting A high performance web server and a reverse pro...r...
Sep 30 11:40:59 elk systemd[1]: Started A high performance web server and a reverse prox...ver.
Sep 30 11:42:06 elk systemd[1]: Started A high performance web server and a reverse prox...ver.
Hint: Some lines were ellipsized, use -l to show in full.
为了测试起见,将端口修改为 88.修改文件/etc/nginx/sites-available/default,并重启 Nginx 服务:
server {
        listen 88 default_server;
        listen [::]:88 default_server;
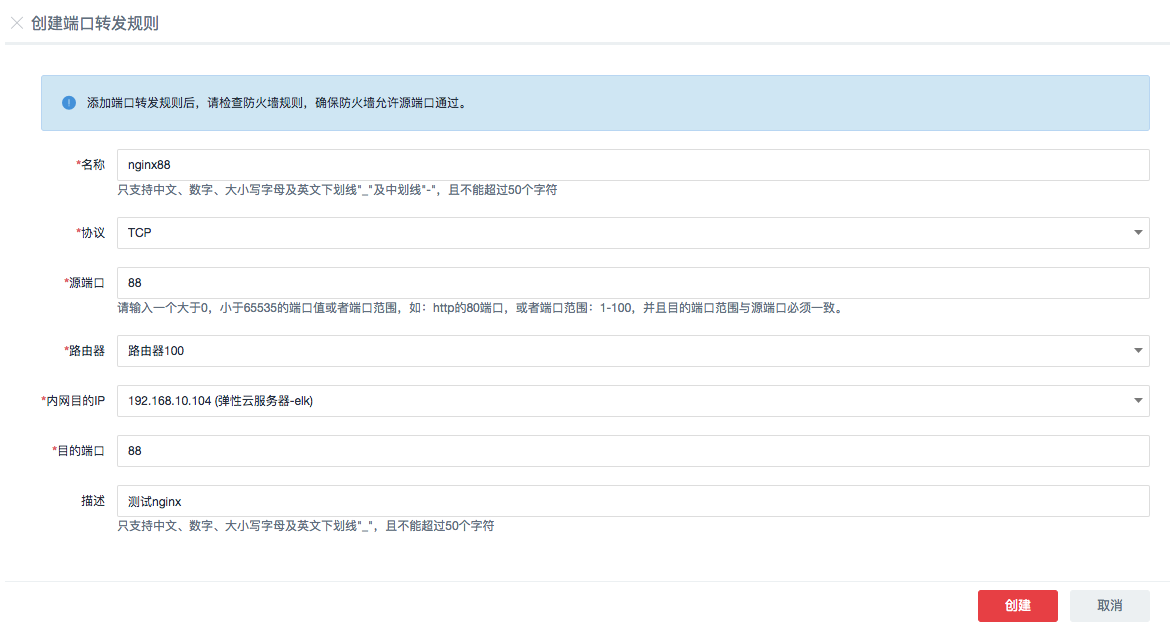
鉴于该服务器没有设置公网IP,在其路由器上设置端口转发规则,使得可以通过路由器的EIP的88端口访问到它上面的Nginx服务:
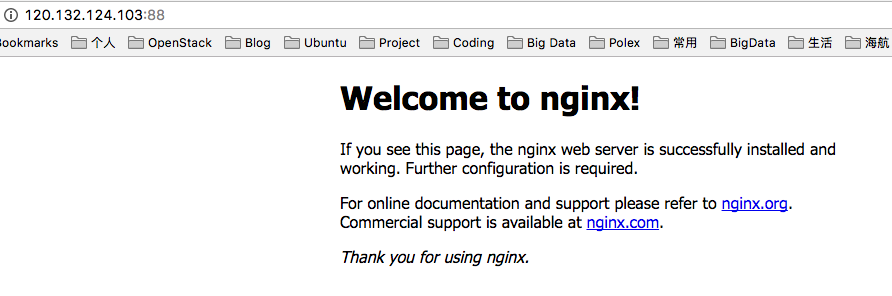
在浏览器上测试,Nginx 可用:
1.2.2 安装和配置 Logstash
wget https://artifacts.elastic.co/downloads/logstash/logstash-5.2.2.tar.gz
tar zxvf logstash-5.2.2.tar.gz
ln -s logstash-5.2.2 logstash
创建文件 nginxlog2es.conf,内容如下。它会将 Nginx 的日志文件 /var/log/nginx/access.log_json 中的日志发到 ES 服务器 192.168.10.102:9200:
input {
    file {
        path => "/var/log/nginx/access.log_json"
        codec => "json"
    }
}
filter {
    mutate {
        split => [ "upstreamtime", "," ]
    }
    mutate {
        convert => [ "upstreamtime", "float" ]
    }
}
output {
  stdout { codec => rubydebug }
  elasticsearch {
        hosts => ["192.168.10.102:9200"]
        index => "logstash-%{type}-%{+YYYY.MM.dd}"
        document_type => "%{type}"
        flush_size => 20000
        idle_flush_time => 10
        sniffing => true
        template_overwrite => true
    }
}
修改 /etc/nginx/nginx.conf,添加:
##
        # Logging Settings
        ##

        log_format json '{"@timestamp":"$time_iso8601",'
          '"host":"$server_addr",'
          '"clientip":"$remote_addr",'
          '"size":$body_bytes_sent,'
          '"responsetime":$request_time,'
          '"upstreamtime":"$upstream_response_time",'
          '"upstreamhost":"$upstream_addr",'
          '"http_host":"$host",'
          '"url":"$uri",'
          '"xff":"$http_x_forwarded_for",'
          '"referer":"$http_referer",'
          '"agent":"$http_user_agent",'
          '"status":"$status"}';
        access_log /var/log/nginx/access.log_json json;
重启 Nginx 服务,在浏览器上刷新页面,查看 Nginx 日志,
{"@timestamp":"2017-09-30T12:44:19+08:00","host":"192.168.10.104","clientip":"140.206.84.10","size":0,"responsetime":0.000,"upstreamtime":"-","upstreamhost":"-","http_host":"120.132.124.103","url":"/index.nginx-debian.html","xff":"-","referer":"-","agent":"Mozilla/5.0 (Macintosh; Intel Mac OS X 10_12_1) AppleWebKit/537.36 (KHTML, like Gecko) Chrome/60.0.3112.101 Safari/537.36","status":"304"}
启动logstash,
nohup logstash/bin/logstash -f nginxlog2es.conf > /tmp/logstash.log 2>&1 &
刷新 Nginx 页面,能看到 logstash 收集到的 Nginx 日志:
{
         "referer" => "-",
           "agent" => "Mozilla/5.0 (Macintosh; Intel Mac OS X 10_12_1) AppleWebKit/537.36 (KHTML, like Gecko) Chrome/60.0.3112.101 Safari/537.36",
       "http_host" => "120.132.124.103",
             "url" => "/index.nginx-debian.html",
            "path" => "/var/log/nginx/access.log_json",
    "upstreamhost" => "-",
      "@timestamp" => 2017-09-30T04:48:23.000Z,
            "size" => 0,
        "clientip" => "140.206.84.10",
            "host" => "192.168.10.104",
        "@version" => "1",
    "responsetime" => 0.0,
             "xff" => "-",
    "upstreamtime" => [
        [0] 0.0
    ],
          "status" => "304"
}
1.3 安装 Kibana
wget https://artifacts.elastic.co/downloads/kibana/kibana-5.2.2-linux-x86_64.tar.gz
ln -s kibana-5.2.2-linux-x86_64 kibana
修改配置文件 kibana/config/kibana.yml,
server.host: "192.168.10.102"
elasticsearch.url: "http://192.168.10.102:9200"
启动 kibana,
nohup kibana/bin/kibana > /tmp/kibana.log 2>&1 &
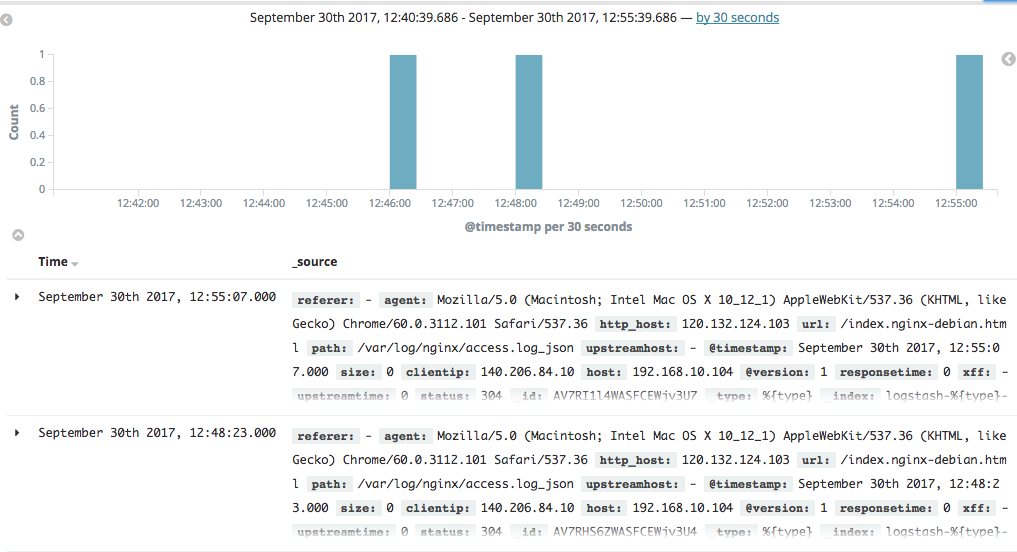
在浏览器里面输入 http://120.132.124.103:5601/ 就可以打开 kibana 页面了。可以看到Nginx 的日志:
1.4 小结
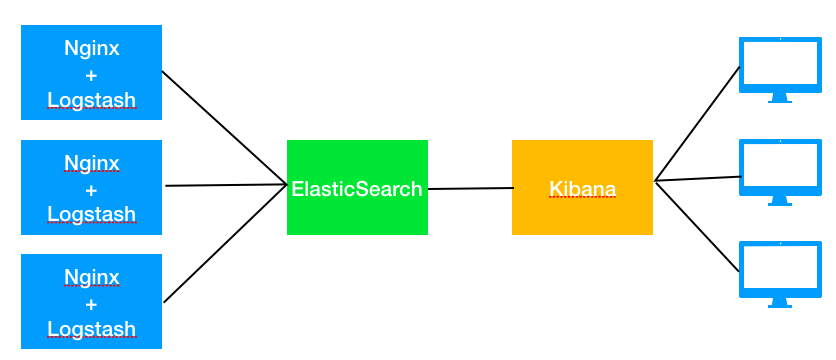
从上面的步骤可以看出,ELK 的结构相对简单:
- Logstack 负责收集日志,并推送到 ES 中
- ES 负责存储
- Kibana 负责界面展示
ELK 的总体架构如下:
但是,这种架构有不少问题,其中问题之一是处理能力问题。bol.com 公司有如下的ELK架构演进路线:
(1)初始架构(2013年)
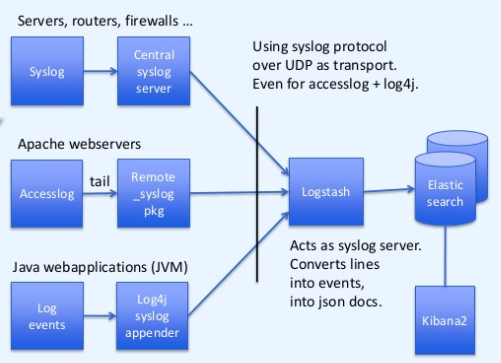
问题是单实例的 logstash 有性能瓶颈。
(2)使用 redis 缓存以及多个 logstash 实例(2014年)
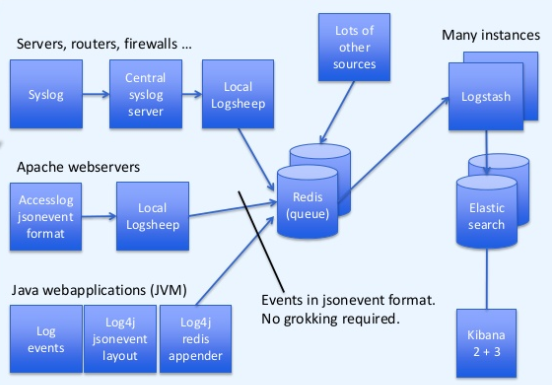
使用 redis 作为消息缓存,使用多实例 Logstash 增加处理性能。
参考链接:
https://devops.profitbricks.com/tutorials/install-and-configure-apache-kafka-on-ubuntu-1604-1/
http://www.cnblogs.com/xiaoqi/p/elk-part1.html
https://www.slideshare.net/TinLe1/elk-atlinked-in
https://www.slideshare.net/renzotoma39/scaling-an-elk-stack-at-bolcom-39412550
https://www.elastic.co/blog/logstash-kafka-intro
https://www.elastic.co/blog/just-enough-kafka-for-the-elastic-stack-part2
https://www.elastic.co/blog/just-enough-kafka-for-the-elastic-stack-part1