
使用python进行新浪微博应用开发
 本篇介绍了如何通过新浪微博的API简单构建一个python应用。
如何在新浪开放平台上创建一个应用?
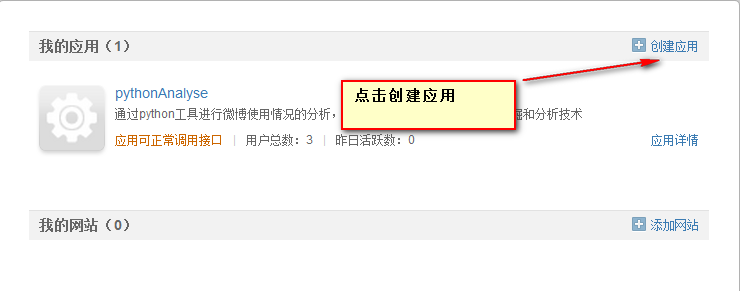
- 在开放平台-我的应用下面创建新的应用。按照提示一步一步创建,傻瓜式的。
- 点击刚才创建的应用进入详细页面,然后查看应用信息-基本信息下面。在程序开发过程中,我们需要app key 和 app secret来调用新浪API。

3. 下载对应语言的sdk,当然这里以python为例。下载地址:http://code.google.com/p/sinaweibopy/。下载完成后将里面的weibo.py复制到你的应用程序同一目录下,或者复制到lib/site-package下。这样你的应用就可以调用sdk了。
4. 在你的程序里面做如下测试,如果你幸运的话你应该能得到正确的返回结果了。
from weibo import APIClient
APP_KEY = 'xxxx' # app key
APP_SECRET = 'xxxx' # app secret
CALLBACK_URL = 'xxxxxx'# callback url
#利用官方微博SDK
client = APIClient(app_key=APP_KEY, app_secret=APP_SECRET, redirect_uri=CALLBACK_URL)
#用得到的url到新浪页面访问
url = client.get_authorize_url()
webbrowser.open_new(url)
#手动输入新浪返回的code
code = raw_input()
#新浪返回的token,类似abc123xyz456,每天的token不一样
r = client.request_access_token(code)
access_token = r.access_token
expires_in = r.expires_in # token过期的UNIX时间
#设置得到的access_token
client.set_access_token(access_token, expires_in)
#有了access_token后,可以做任何事情了
client.get.friendships__followers()
5. 利用API做你能想到的任何事情,比如我做了一个粉丝和关注者的性别分析:

要实现这个统计很简单,首先获得某个用户的所有关注者:
def GetAllFriends(self,uid):
"""
得到所有的关注对象
返回:(screenName,gender)元组数组
"""
resFollows = []
nextCursor = -1
while nextCursor != 0:
followers = self.client.get.friendships__friends(uid=uid,count=200,cursor=nextCursor)
nextCursor = followers["next_cursor"]
for follower in followers["users"]:
resFollows.append( (follower["screen_name"],follower["gender"]) )
print len(resFollows)
return resFollows
"""
得到所有的关注对象
返回:(screenName,gender)元组数组
"""
resFollows = []
nextCursor = -1
while nextCursor != 0:
followers = self.client.get.friendships__friends(uid=uid,count=200,cursor=nextCursor)
nextCursor = followers["next_cursor"]
for follower in followers["users"]:
resFollows.append( (follower["screen_name"],follower["gender"]) )
print len(resFollows)
return resFollows
然后利用matplotlib这个第三方库进行绘图即可。关于matplotlib我想我后面会写一些文章进行说明的,很强大的一个二维绘图库。def FriendsMaleOrFemale(uid):
wb = MySinaWeiBo()
m = 0
f = 0
n = 0
for i in wb.GetAllFriends(uid):
if i[1] == "m":
m = m+1
elif i[1] == "f":
f = f+1
else:
n = n+1
ind = np.arange(1,4) # np.arange(1,N+1) # the x locations for the groups
width = 0.25 # the width of the bars
plt.subplot(111)
rects1 = plt.bar(ind, (m,f,n), width,bottom = 0,align = 'center')
#增加Y轴说明
plt.ylabel(u'关注数')
#增加标题
plt.title(u'我关注的人性别分析(有效样本:%d)' % (m+f+n))
#设置x坐标位置和文字
plt.xticks(ind, (u"男",u"女",u"未知") )
autolabel(rects1)
plt.legend(rects1,(u"用户:%s" % wb.GetUserByUid(uid),))
plt.show()

