
R + ggplot2 Graph Catalog(转)
Joanna Zhao’s and Jenny Bryan’s R graph catalog is meant to be a complement to the physical book,Creating More Effective Graphs, but it’s a really nice gallery in its own right. The catalog shows a series of different data visualizations, all made with R and ggplot2. Click on any of the plots and you get the R code necessary to generate the data and produce the plot.

You can use the panel on the left to filter by plot type, graphical elements, or the chapter of the book if you’re actually using it. All of the code and data used for this website is open-source, in this GitHub repository. Here's an example for plotting population demographic data by county that uses faceting to create small multiples:
library(ggplot2)
library(reshape2)
library(grid)

this_base = "fig08-15_population-data-by-county"

my_data = data.frame(
  Race = c("White", "Latino", "Black", "Asian American", "All Others"),
  Bronx = c(194000, 645000, 415000, 38000, 40000),
  Kings = c(855000, 488000, 845000, 184000, 93000),
  New.York = c(703000, 418000, 233000, 143000, 39000),
  Queens = c(733000, 556000, 420000, 392000, 128000),
  Richmond = c(317000, 54000, 40000, 24000, 9000),
  Nassau = c(986000, 133000, 129000, 62000, 24000),
  Suffolk = c(1118000, 149000, 92000, 34000, 26000),
  Westchester = c(592000, 145000, 123000, 41000, 23000),
  Rockland = c(205000, 29000, 30000, 16000, 6000),
  Bergen = c(638000, 91000, 43000, 94000, 18000),
  Hudson = c(215000, 242000, 73000, 57000, 22000),
  Passiac = c(252000, 147000, 60000, 18000, 12000))

my_data_long = melt(my_data, id = "Race",
                     variable.name = "county", value.name = "population")

my_data_long$county = factor(
  my_data_long$county, c("New.York", "Queens", "Kings", "Bronx", "Nassau",
                         "Suffolk", "Hudson", "Bergen", "Westchester",
                         "Rockland", "Richmond", "Passiac"))

my_data_long$Race =
  factor(my_data_long$Race,
         rev(c("White", "Latino", "Black", "Asian American", "All Others")))

p = ggplot(my_data_long, aes(x = population / 1000, y = Race)) +
  geom_point() +
  facet_wrap(~ county, ncol = 3) +
  scale_x_continuous(breaks = seq(0, 1000, 200),
                     labels = c(0, "", 400, "", 800, "")) +
  labs(x = "Population (thousands)", y = NULL) +
  ggtitle("Fig 8.15 Population Data by County") +
  theme_bw() +
  theme(panel.grid.major.y = element_line(colour = "grey60"),
        panel.grid.major.x = element_blank(),
        panel.grid.minor = element_blank(),
        panel.margin = unit(0, "lines"),
        plot.title = element_text(size = rel(1.1), face = "bold", vjust = 2),
        strip.background = element_rect(fill = "grey80"),
        axis.ticks.y = element_blank())

p

ggsave(paste0(this_base, ".png"),
       p, width = 6, height = 8)

Keep in mind not all of these visualizations are recommended. You’ll find pie charts, ugly grouped bar charts, and other plots for which I can’t think of any sensible name. Just because you can use the
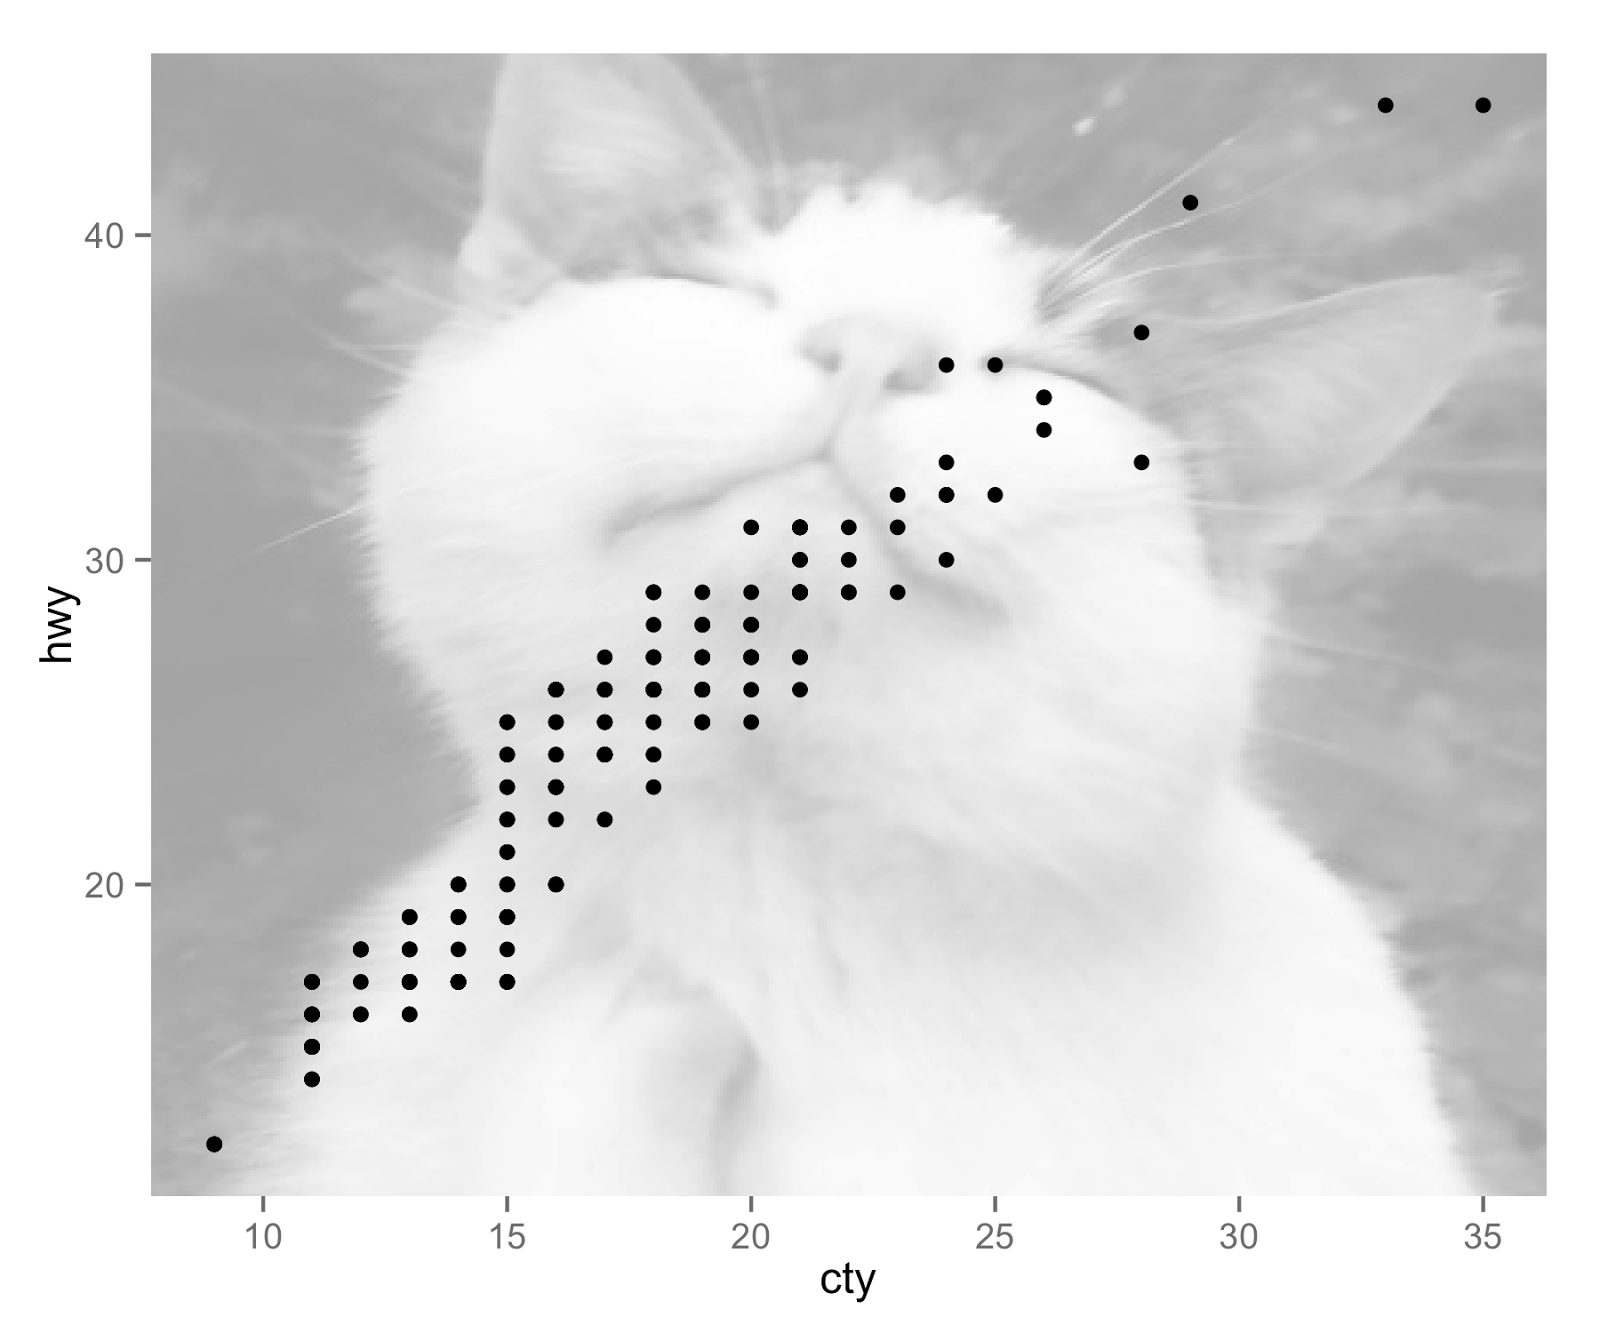
add_cat() function from Hilary Parker’s cats package to fetch a random cat picture from the internet and create an annotation_raster layer to add to your ggplot2 plot, doesn’t necessarily mean you shoulddo such a thing for a publication-quality figure. But if you ever needed to know how, this R graph catalog can help you out.library(ggplot2) this_base = "0002_add-background-with-cats-package" ## devtools::install_github("hilaryparker/cats") library(cats) ## library(help = "cats") p = ggplot(mpg, aes(cty, hwy)) + add_cat() + geom_point() p ggsave(paste0(this_base, ".png"), p, width = 6, height = 5)
----------------------------------------------------------------------------------
数据和特征决定了效果上限,模型和算法决定了逼近这个上限的程度
----------------------------------------------------------------------------------

