
Linux常用系统性能监控命令
-->Linux常用系统性能监控命令
Linux常用系统性能监控命令
来源:工学1号馆
链接:http://wuyudong.com/archives/56
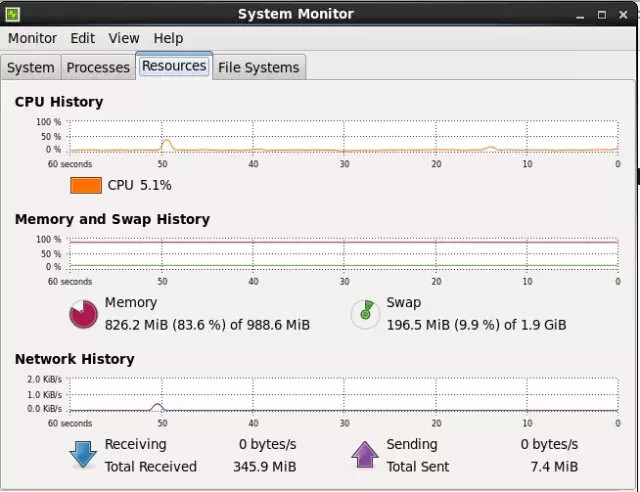
监控CPU使用率
使用下面的命令:
[root@localhost ~]# gnome-system-monitor
将会出现图形化工具GNOME System Monitor,如下图所示:
监控CPU调度程序运行队列
linux可以使用vmstat命令
vmstat是Virtual Meomory Statistics(虚拟内存统计)的缩写, 是实时系统监控工具。该命令通过使用knlist子程序和/dev/kmen伪设备驱动器访问这些数据,输出信息直接打印在屏幕。vmstat反馈的与CPU相关的信息包括:
(1)多少任务在运行
(2)CPU使用的情况
(3)CPU收到多少中断
(4)发生多少上下文切换
下面只介绍 Vmstat与CPU相关的参数
vmstat的语法如下:
vmstat [delay [count]]
参数的含义如下:
| 参数 | 解释 |
|---|---|
| delay | 相邻的两次采样的间隔时间 |
| count | 采样的次数,count只能和delay一起使用 |
当没有参数时,vmstat则显示系统启动以后所有信息的平均值。有delay时,第一行的信息自系统启动以来的平均信息。从第二行开始,输出为前一个delay时间段的平均信息。当系统有多个CPU时,输出为所有CPU的平均值。
| 参数 | 解释 | 从/proc/stat获得数据 |
|---|---|---|
| r | 在internal时间段里,运行队列里等待CPU的任务(任务)的个数,即不包含vmstat进程 | procs_running-1 |
| b | 在internal时间段里,被资源阻塞的任务数(I/0,页面调度,等等.)通常情况下是接近0的 | procs_blocked |
| us | 在internal时间段里,用户态的CPU时间(%),包含 nice值为负进程 | (user+nice)/total*100 |
| sy | 在internal时间段里,核心态的CPU时间(%) | (system+irq+softirq)/total*100 |
| id | 在internal时间段里,cpu空闲的时间,不包括等待i/o的时间(%) | idle/total*100 |
| wa | 在internal时间段里,等待i/o的时间(%) | iowait/total*100 |
| in | 在internal时间段里,每秒发生中断的次数 | intr/interval |
| cs | 在internal时间段里,每秒上下文切换的次数,即每秒内核任务交换的次数 | ctxt/interval |
total_cur = user + system + nice + idle + iowait + irq + softirq
total_pre = pre_user + pre_system + pre_nice + pre_idle + pre_iowait + pre_irq + pre_softirq
total = total_cur - total_pre
[root@localhost ~]# vmstat
运行结果如下:

监控锁竞争
使用 sysstat包中的pidstat命令来监控
[root@localhost ~]# pidstat
运行结果如下:
Linux 2.6.32-431.el6.x86_64 (localhost.localdomain) 05/07/15 _x86_64_ (1 CPU)
09:58:18 PID %usr %system %guest %CPU CPU Command
09:58:18 1 0.00 0.00 0.00 0.00 0 init
09:58:18 4 0.00 0.00 0.00 0.00 0 ksoftirqd/0
……
09:58:18 37143 0.00 0.00 0.00 0.00 0 dbus-launch
09:58:18 37144 0.00 0.00 0.00 0.00 0 dbus-daemon
09:58:18 37268 0.00 0.00 0.00 0.00 0 fprintd
09:58:18 37272 0.00 0.00 0.00 0.00 0 pidstat
监控网络I/O使用率
nicstat原本是Solaris平台下显示网卡流量的工具,Tim Cook将它移植到linux平台
首先安装之,源码在这里下, 这里使用的版本是1.92。
安装make环境:
yum install gcc gcc-c++ make automake autoconf -y
由于nicstat依赖32 bit glibc package,所以
yum install libgcc.i686 glibc.i686 glibc-devel.i686 -y
下载文件并安装:
# wget -c http://nchc.dl.sourceforge.net/project/nicstat/nicstat-1.92.tar.gz
# tar zxvf nicstat-1.92.tar.gz
# cd nicstat-1.92
# cp Makefile.Linux Makefile
# uname -m
[root@localhost nicstat-1.92]# make
gcc -O3 -m32 nicstat.c -o nicstat
nicstat.c:99:1: warning: "DUPLEX_UNKNOWN" redefined
In file included from nicstat.c:84:
/usr/include/linux/ethtool.h:691:1: warning: this is the location of the previous definition
mv nicstat `./nicstat.sh --bin-name`
[root@localhost nicstat-1.92]# ./nicstat.sh

磁盘I/O使用率
iostat [-t] [-c] [interval [count]]
参数的含义如下:
| 参数 | 解释 |
|---|---|
| T | 表示输出采用的时间 |
| C | 表示只显示CPU的信息 |
| Internal | 相邻的两次采样的间隔时间 |
| count | 采样的次数,count只能和delay一起使用 |
当没有参数时,iostat则显示系统启动以后所有信息的平均值。与CPU有关的输出的含义
| 参数 | 解释 | 从/proc/stat获得 |
|---|---|---|
| CPU | 处理器ID | |
| user | 在internal时间段里,用户态的CPU时间(%) ,不包含 nice值为负进程 | usr/total*100 |
| nice | 在internal时间段里,nice值为负进程的CPU时间(%) | nice/total*100 |
| sys | 在internal时间段里,核心时间(%) | (system+irq+softirq)/total*100 |
| iowait | 在internal时间段里,硬盘IO等待时间(%) | iowait/total*100 |
| idle | 在internal时间段里,CPU除去等待磁盘IO操作外的因为任何原因而空闲的时间闲置时间 (%) | idle/total*100 |
total_cur = user + system + nice + idle + iowait + irq + softirq
total_pre = pre_user + pre_system + pre_nice + pre_idle + pre_iowait + pre_irq + pre_softirq
total = total_cur - total_pre
有interval时,第一行的信息自系统启动以来的平均信息。从第二行开始,输出为前一个interval时间段的平均信息。
使用iostat命令
[root@localhost ~]# iostat
运行结果如下:
Linux 2.6.32-431.el6.x86_64 (localhost.localdomain) 05/07/15 _x86_64_ (1 CPU)
avg-cpu: %user %nice %system %iowait %steal %idle
6.12 0.00 1.35 2.35 0.00 90.19
Device: tps Blk_read/s Blk_wrtn/s Blk_read Blk_wrtn
sda 6.03 267.11 272.53 26904430 27450404
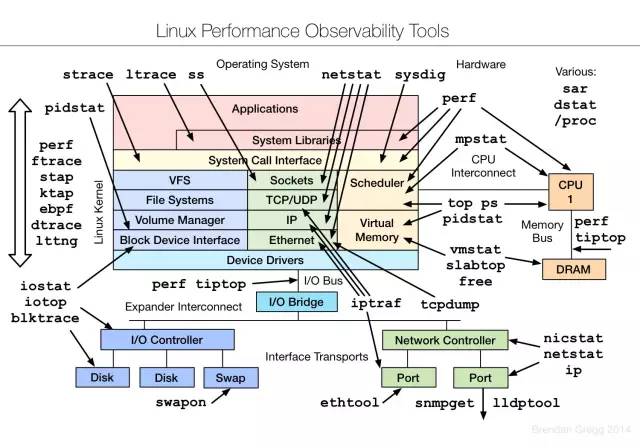
PS:附上Brendan Gregg 个人站点上分享了很多 Linux 性能相关的资源:
Linux observability tools | Linux 性能观测工具
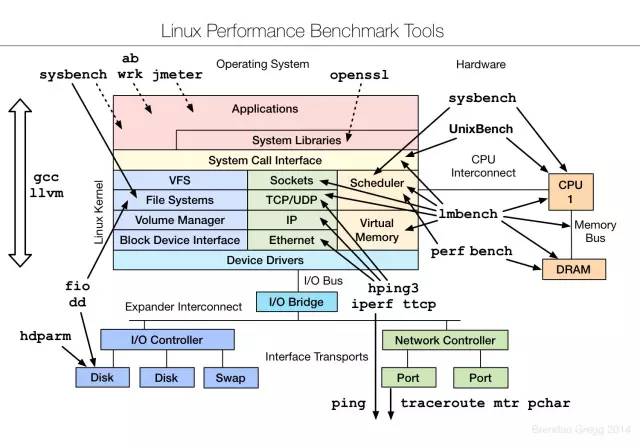
Linux benchmarking tools | Linux 性能测评工具
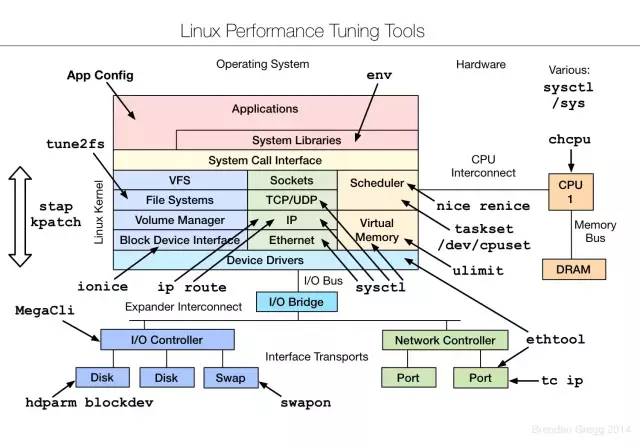
Linux tuning tools | Linux 性能调优工具
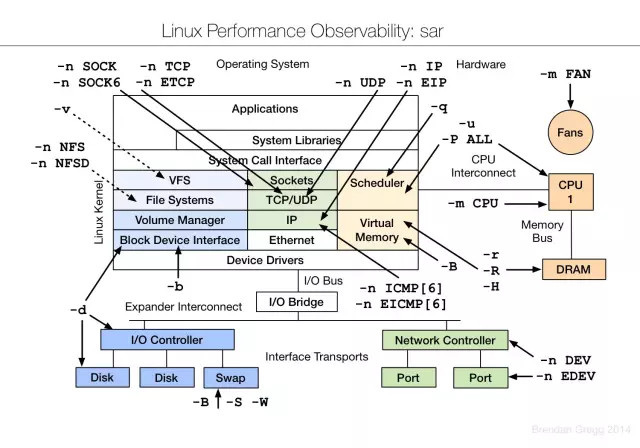
Linux observability sar
愈看更多图表和演讲,请移步:http://www.brendangregg.com/linuxperf.html
补充:去年在微博分享 Brendan Gregg 在 SCaLE 11x 大会上的演讲《Linux Performance Analysis and Tools | Linux 性能分析和工具》,这个链接(https://www.joyent.com/blog/linux-performance-analysis-and-tools-brendan-gregg-s-talk-at-scale-11x )中有演讲视频(Youtube)和幻灯片(SlideShare),所以请自带梯子访问。
参考资料
http://www.cnblogs.com/argb/p/3448661.html
http://blog.jobbole.com/76103/ 《大牛分享的 Linux 性能工具》
http://blog.yufeng.info/archives/2518


