Paul S. Randal的扩展事件系列 30日学扩展事件
Paul S. Randal的扩展事件系列 30日学扩展事件
地址:http://www.sqlskills.com/blogs/jonathan/an-xevent-a-day-31-days-of-extended-events/
查询扩展时间相关DMV
Querying the Extended Events Metadata
http://www.sqlskills.com/blogs/jonathan/querying-extended-events-metadata/
sys.dm_xe_packages

-- Extended Event Packages
    SELECT
        name,
        guid,
        description
    FROM sys.dm_xe_packages p
    WHERE (p.capabilities IS NULL OR p.capabilities & 1 = 0)

SELECT
        p.name,
        p.description,
        lm.name
    FROM sys.dm_xe_packages p
    JOIN sys.dm_os_loaded_modules lm
        ON p.module_address = lm.base_address
    WHERE (p.capabilities IS NULL OR p.capabilities & 1 = 0)


Events

    -- Event objects
    SELECT p.name AS package_name,
            o.name AS event_name,
            o.description
    FROM sys.dm_xe_packages AS p
    JOIN sys.dm_xe_objects AS o
         ON p.guid = o.package_guid
    WHERE (p.capabilities IS NULL OR p.capabilities & 1 = 0)
       AND (o.capabilities IS NULL OR o.capabilities & 1 = 0)
       AND o.object_type = 'event'


Actions

    -- Actions
    SELECT p.name AS package_name,
            o.name AS action_name,
            o.description
    FROM sys.dm_xe_packages AS p
    JOIN sys.dm_xe_objects AS o
          ON p.guid = o.package_guid
    WHERE (p.capabilities IS NULL OR p.capabilities & 1 = 0)
       AND (o.capabilities IS NULL OR o.capabilities & 1 = 0)
       AND o.object_type = 'action'


Targets

    -- Targets
    SELECT p.name AS package_name,
            o.name AS target_name,
            o.description
    FROM sys.dm_xe_packages AS p
    JOIN sys.dm_xe_objects AS o ON p.guid = o.package_guid
    WHERE (p.capabilities IS NULL OR p.capabilities & 1 = 0)
       AND (o.capabilities IS NULL OR o.capabilities & 1 = 0)
       AND o.object_type = 'target'


Predicate Sources

    -- State Data Predicates
    SELECT p.name AS package_name,
            o.name AS source_name,
            o.description
    FROM sys.dm_xe_objects AS o
    JOIN sys.dm_xe_packages AS p
          ON o.package_guid = p.guid
    WHERE (p.capabilities IS NULL OR p.capabilities & 1 = 0)
       AND (o.capabilities IS NULL OR o.capabilities & 1 = 0)
       AND o.object_type = 'pred_source'

Predicate Comparators

    -- Comparison Predicates
    SELECT p.name AS package_name,
            o.name AS source_name,
            o.description
    FROM sys.dm_xe_objects AS o
    JOIN sys.dm_xe_packages AS p
          ON o.package_guid = p.guid
    WHERE (p.capabilities IS NULL OR p.capabilities & 1 = 0)
       AND (o.capabilities IS NULL OR o.capabilities & 1 = 0)
       AND o.object_type = 'pred_compare'

Maps

    -- Maps
    SELECT p.name AS package_name,
            o.name AS source_name,
            o.description
    FROM sys.dm_xe_objects AS o
    JOIN sys.dm_xe_packages AS p
          ON o.package_guid = p.guid
    WHERE (p.capabilities IS NULL OR p.capabilities & 1 = 0)
       AND (o.capabilities IS NULL OR o.capabilities & 1 = 0)
       AND o.object_type = 'map'


Types

    -- Types
    SELECT p.name AS package_name,
            o.name AS source_name,
            o.description
    FROM sys.dm_xe_objects AS o
    JOIN sys.dm_xe_packages AS p
          ON o.package_guid = p.guid
    WHERE (p.capabilities IS NULL OR p.capabilities & 1 = 0)
       AND (o.capabilities IS NULL OR o.capabilities & 1 = 0)
       AND o.object_type = 'Type'


-- Event Columns
    SELECT oc.name AS column_name,
            oc.column_type AS column_type,
            oc.column_value AS column_value,
            oc.description AS column_description
    FROM sys.dm_xe_packages AS p
    JOIN sys.dm_xe_objects AS o
          ON p.guid = o.package_guid
    JOIN sys.dm_xe_object_columns AS oc
          ON o.name = oc.OBJECT_NAME
         AND o.package_guid = oc.object_package_guid
    WHERE (p.capabilities IS NULL OR p.capabilities & 1 = 0)
       AND (o.capabilities IS NULL OR o.capabilities & 1 = 0)
       AND (oc.capabilities IS NULL OR oc.capabilities & 1 = 0)
       AND o.object_type = 'event'
       AND o.name = 'wait_info'


-- Configurable Event Columns
    SELECT oc.name AS column_name,
            oc.column_type AS column_type,
            oc.column_value AS column_value,
            oc.description AS column_description
    FROM sys.dm_xe_packages AS p
    JOIN sys.dm_xe_objects AS o
          ON p.guid = o.package_guid
    JOIN sys.dm_xe_object_columns AS oc
          ON o.name = oc.OBJECT_NAME
         AND o.package_guid = oc.object_package_guid
    WHERE (p.capabilities IS NULL OR p.capabilities & 1 = 0)
       AND (o.capabilities IS NULL OR o.capabilities & 1 = 0)
       AND (oc.capabilities IS NULL OR oc.capabilities & 1 = 0)
       AND o.object_type = 'event'
       AND o.name = 'file_write_completed'
       AND oc.column_type = 'customizable'


    -- Target Configurable Fields
    SELECT oc.name AS column_name,
            oc.column_id,
            oc.type_name,
            oc.capabilities_desc,
            oc.description
    FROM sys.dm_xe_packages AS p
    JOIN sys.dm_xe_objects AS o
          ON p.guid = o.package_guid
    JOIN sys.dm_xe_object_columns AS oc
          ON o.name = oc.OBJECT_NAME
         AND o.package_guid = oc.object_package_guid
    WHERE (p.capabilities IS NULL OR p.capabilities & 1 = 0)
       AND (o.capabilities IS NULL OR o.capabilities & 1 = 0)
       AND o.object_type = 'target'
       AND o.name = 'asynchronous_file_target'


    -- Map Values
    SELECT name, map_key, map_value
    FROM sys.dm_xe_map_values
    WHERE name = 'wait_types'
创建扩展事件的例子
Managing Event Sessions
http://www.sqlskills.com/blogs/jonathan/managing-extended-events-sessions/
    CREATE EVENT SESSION [TrackTempdbFileWrites] ON SERVER
    ADD EVENT sqlserver.file_write_completed(
       SET collect_path = 1
       ACTION (sqlserver.sql_text)
       WHERE database_id = 2),
    ADD EVENT sqlserver.file_written(
       WHERE database_id = 2)
    ADD TARGET package0.ring_buffer,
    ADD TARGET package0.asynchronous_bucketizer(
         SET filtering_event_name='sqlserver.file_write_completed', source_type=0, source='file_id')
    WITH (MAX_MEMORY=4096 KB,
         EVENT_RETENTION_MODE=ALLOW_SINGLE_EVENT_LOSS,
         MAX_DISPATCH_LATENCY=30 SECONDS,
         MAX_EVENT_SIZE=0 KB,
         MEMORY_PARTITION_MODE=NONE,
         TRACK_CAUSALITY=OFF,
         STARTUP_STATE=OFF)
    GO


    -- ALTER the Event Session to Start it
    ALTER EVENT SESSION [TrackTempdbFileWrites]
    ON SERVER
    STATE=START
    GO


    USE [tempdb]
    GO
    IF OBJECT_ID('Test') IS NOT NULL
       DROP TABLE Test
    CREATE TABLE Test (rowid INT IDENTITY PRIMARY KEY, exampledata VARCHAR(4000))
    GO
    INSERT INTO Test(exampledata) VALUES (REPLICATE('abcd', 1000))
    GO 100
    ALTER EVENT SESSION [TrackTempdbFileWrites]
    ON SERVER
    DROP EVENT sqlserver.file_write_completed,
    DROP EVENT sqlserver.file_written
    GO
    SELECT CAST(target_data AS XML)
    FROM sys.dm_xe_session_targets st
    JOIN sys.dm_xe_sessions s ON st.event_session_address = s.address
    WHERE s.name = 'TrackTempdbFileWrites'
    GO

    USE [tempdb]
    GO
    IF OBJECT_ID('Test') IS NOT NULL
       DROP TABLE Test
    CREATE TABLE Test (rowid INT IDENTITY PRIMARY KEY, exampledata VARCHAR(4000))
    GO
    INSERT INTO Test(exampledata) VALUES (REPLICATE('abcd', 1000))
    GO 100
    SELECT CAST(target_data AS XML)
    FROM sys.dm_xe_session_targets st
    JOIN sys.dm_xe_sessions s ON st.event_session_address = s.address
    WHERE s.name = 'TrackTempdbFileWrites'
    GO

    -- Add the sqlserver.file_write_completed back with new predicates
    ALTER EVENT SESSION [TrackTempdbFileWrites]
    ON SERVER
    ADD EVENT sqlserver.file_write_completed(
       SET collect_path = 1
       ACTION (sqlserver.sql_text)
       WHERE database_id = 2 AND FILE_ID = 1)

    USE [tempdb]
    GO
    IF OBJECT_ID('Test') IS NOT NULL
       DROP TABLE Test
    CREATE TABLE Test (rowid INT IDENTITY PRIMARY KEY, exampledata VARCHAR(4000))
    GO
    INSERT INTO Test(exampledata) VALUES (REPLICATE('abcd', 1000))
    GO 100
    SELECT CAST(target_data AS XML)
    FROM sys.dm_xe_session_targets st
    JOIN sys.dm_xe_sessions s ON st.event_session_address = s.address
    WHERE s.name = 'TrackTempdbFileWrites'
    GO

    -- Add a file target
    ALTER EVENT SESSION [TrackTempdbFileWrites]
    ON SERVER
    ADD TARGET package0.asynchronous_file_target
    ( SET filename = 'C:\SQLBlog\TrackTempdbFileWrites.xel',
         metadatafile = 'C:\SQLBlog\TrackTempdbFileWrites.mta')
    GO
    -- Drop a ring_buffer target
    ALTER EVENT SESSION [TrackTempdbFileWrites]
    ON SERVER
    DROP TARGET package0.ring_buffer
    GO

Msg 25707, Level 16, State 1, Line 2 Event session option "event_retention_mode" cannot be changed while the session is running. Stop the event session before changing this session option.


    -- Stop the Event Seession first
    ALTER EVENT SESSION [TrackTempdbFileWrites]
    ON SERVER
    STATE=STOP
    GO
    -- Change Event Retention Mode
    ALTER EVENT SESSION [TrackTempdbFileWrites]
    ON SERVER
    WITH (EVENT_RETENTION_MODE = NO_EVENT_LOSS)
    GO
    -- Start the Event Seession after the change
    ALTER EVENT SESSION [TrackTempdbFileWrites]
    ON SERVER
    STATE=START
    GO


    DROP EVENT SESSION [TrackTempdbFileWrites] ON SERVER
扩展事件定义相关DMVs
Querying the Session Definition and Active Session DMV’s
--http://www.sqlskills.com/blogs/jonathan/extended-events-dmvs/
sys.server_event_sessions

The sys.server_event_sessions DMV provides information about the Event Sessions that exist inside of the Extended Events Engine.  The Session level options for the Event Session can be retrieved from this DMV, to determine how the Event Session is configured.


-- Session level information for current Event Sessions
SELECT
   s.name,
   s.max_memory,
   s.event_retention_mode_desc,
   s.max_dispatch_latency,
   s.max_event_size,
   s.memory_partition_mode_desc,
   s.track_causality,
   s.startup_state
FROM sys.server_event_sessions AS s;


sys.server_event_session_events

The sys.server_event_session_events DMV provides information about the specific Events that are defined in the Event Sessions maintained by the Extended Events Engine.  This DMV also returns the defined Predicates for the Events that are included for collection in Event Sessions on the server.  The event_session_id column can be used to join this DMV to sys.server_event_sessions as shown below.


-- Get events in a session
SELECT
   ses.name AS session_name,
   sese.package AS event_package,
   sese.name AS event_name,
   sese.predicate AS event_predicate
FROM sys.server_event_sessions AS ses
INNER JOIN sys.server_event_session_events AS sese
    ON ses.event_session_id = sese.event_session_id;


sys.server_event_session_actions

The sys.server_event_session_actions DMV contains one row for each of the Actions that have been added to an Event in an Event Session.  If the same Action was added to multiple Events, there would be a separate row per Event and Action pair in the Event Session.  The event_session_id and event_id columns are used to join this DMV to the sys.server_event_session_events DMV.


-- Get actions
SELECT
   ses.name AS session_name,
   sese.package AS event_package,
   sese.name AS event_name,
   sese.predicate AS event_predicate,
   sesa.package AS action_package,
   sesa.name AS action_name
FROM sys.server_event_sessions AS ses
INNER JOIN sys.server_event_session_events AS sese
    ON ses.event_session_id = sese.event_session_id
INNER JOIN sys.server_event_session_actions AS sesa
     ON ses.event_session_id = sesa.event_session_id
    AND sese.event_id = sesa.event_id;


sys.server_event_session_targets

The sys.server_event_session_targets DMV contains one row for each of the configured Targets that are defined for an Event Session.  The event_session_id column is used to join this DMV to the sys.server_event_sessions DMV.


-- Get target information
SELECT
   ses.name AS session_name,
   sest.name AS target_name
FROM sys.server_event_sessions AS ses
INNER JOIN sys.server_event_session_targets AS sest
   ON ses.event_session_id = sest.event_session_id;


sys.server_event_session_fields

The sys.server_event_session_fields DMV contains one row for each of the configured options for each Target defined for an Event Session.  The event_session_id and target_id columns are used to join this DMV to the sys.server_event_session_targets DMV.

-- Get target option information
SELECT
   ses.name AS session_name,
   sest.name AS target_name,
   sesf.name AS option_name,
   sesf.value AS option_value
FROM sys.server_event_sessions AS ses
INNER JOIN sys.server_event_session_targets AS sest
   ON ses.event_session_id = sest.event_session_id
INNER JOIN sys.server_event_session_fields AS sesf
   ON sest.event_session_id = sesf.event_session_id
   AND sest.target_id = sesf.object_id;


Extended Events Active Session DMV’s
sys.dm_xe_sessions

The sys.dm_xe_sessions DMV contains one row for each active Event Session (STATE=START) in the SQL Server Instance, and provides information about the configuration of the Session buffers.  Information about the size, and number of buffers is returned for the regular sized and large sized buffers associated with the Event Session.  An Event Session will have large sized buffers when the MAX_EVENT_SIZE configured is larger than the regular buffer size.  In general, most Events will be buffered to the regular buffers.  Information about event loss associated with the buffers being full and buffers that are full and pending dispatch is also contained in this DMV.


-- Look at Active Session Information
SELECT
   s.name,
   s.pending_buffers,
   s.total_regular_buffers,
   s.regular_buffer_size,
   s.total_large_buffers,
   s.large_buffer_size,
   s.total_buffer_size,
   s.buffer_policy_flags,
   s.buffer_policy_desc,
   s.flags,
   s.flag_desc,
   s.dropped_event_count,
   s.dropped_buffer_count,
   s.blocked_event_fire_time,
   s.create_time,
   s.largest_event_dropped_size
FROM sys.dm_xe_sessions AS s;

sys.dm_xe_session_targets

The sys.dm_xe_session_targets DMV will contain one row for each Target that exists for an active Event Session.  Information about the Target such as the Target name (ring_buffer, pair_matching, etc.) and Target execution statistics are returned by this DMV.  For memory resident Targets, the target_data columns will return an XML document containing the information about the Events that have been dispatched to the Target and are still available.  For persisted Targets, the target_data column still contains an XML document, but only statistics about the Target will be contained in the document.  More specific information about the target_data column will be provided in the next week as we look at each Target individually.  The event_session_address column is used to join this DMV to the address column in the sys.dm_xe_sessions DMV.


-- Target information for a running session
SELECT
   s.name AS session_name,
   t.target_name AS target_name,
   t.execution_count AS execution_count,
   t.execution_duration_ms AS execution_duration,
   CAST(t.target_data AS XML) AS target_data
FROM sys.dm_xe_sessions AS s
INNER JOIN sys.dm_xe_session_targets AS t
   ON s.address = t.event_session_address;
sys.dm_xe_session_events

The sys.dm_xe_session_events DMV contains one row for each Event that is defined in an Active Event Session.  The predicate definition for each event, if defined, is included in the output of this DMV.  However, the predicate is not the same as returned by sys.server_event_session_events if standard logical operators were used in the Event definition.  Instead the Predicates are converted to use Predicate Comparators in text form, and for complex Predicates, the length can exceed the allowable output.  When this occurs, “Predicate too large for display” will be returned by the DMV.  The event_session_address column is used to join this DMV to the address column in the sys.dm_xe_sessions DMV.


-- Event Information for a running session
SELECT s.name AS session_name,
       e.event_name AS event_name,
       e.event_predicate AS event_predicate
FROM sys.dm_xe_sessions AS s
INNER JOIN sys.dm_xe_session_events AS e
     ON s.address = e.event_session_address;
sys.dm_xe_session_event_actions

The sys.dm_xe_session_event_actions DMV contains one row for each Action that is defined on an Event in an Active Event Session.  If the same Action is defined on multiple Events in the Event Session, one row will be returned for each Event/Action pair.  The event_session_address and event_name columns are used to join this DMV to the address column in the sys.dm_xe_session_events DMV.


-- Event Information with Actions for a running session
SELECT s.name AS session_name,
       e.event_name AS event_name,
       e.event_predicate AS event_predicate,
       ea.action_name AS action_name
FROM sys.dm_xe_sessions AS s
INNER JOIN sys.dm_xe_session_events AS e
     ON s.address = e.event_session_address
INNER JOIN sys.dm_xe_session_event_actions AS ea
     ON e.event_session_address = ea.event_session_address
    AND e.event_name = ea.event_name;
sys.dm_xe_session_object_columns

The sys.dm_xe_session_object_columns DMV contains one row for each of the configured options for a Target that is defined in an Active Event Session, as well as one row for each of the customizable Data Elements for a Event that is defined in an Active Event Session.  The event_session_address and event_name columns are used to join this DMV to the address column in the sys.dm_xe_session_events DMV.  The event_session_address and target_name columns are used to join this DMV to the address column in the sys.dm_xe_session_targets DMV.


-- Configurable event and target column information
SELECT DISTINCT s.name AS session_name,
       oc.OBJECT_NAME,
       oc.object_type,
       oc.column_name,
       oc.column_value
FROM sys.dm_xe_sessions AS s
INNER JOIN sys.dm_xe_session_targets AS t
     ON s.address = t.event_session_address
INNER JOIN sys.dm_xe_session_events AS e
     ON s.address = e.event_session_address
INNER JOIN sys.dm_xe_session_object_columns AS oc
     ON s.address = oc.event_session_address
       AND ((oc.object_type = 'target' AND t.target_name = oc.object_name)
       OR (oc.object_type = 'event' AND e.event_name = oc.object_name));
ring_buffer是什么 ?ring_buffer目标
Targets Week – ring_buffer
--http://www.sqlskills.com/blogs/jonathan/extended-events-ring_buffer/
What is the ring_buffer?

The ring_buffer is one of two targets available in Extended Events that captures event data in its raw format.  The ring_buffer is a memory resident target that holds event data in a single XML document while the Event Session is active on the SQL Server.  When the Event Session is stopped, the memory buffers allocated to the ring_buffer target are freed and all data contained in the target disappears.  The ring_buffer collects events in a First In First Out (FIFO) manner that can be configured to be strict, where the oldest event is removed when the memory allocated to the target become full and new events arrive, or per event, allowing you to specify the maximum number of occurrences that will be retained for each event defined in the event session.  The default configuration for event flushing is strict FIFO.

Configuration Options

The ring_buffer like most of the targets has configuration options that can be found in the sys.dm_xe_object_columns DMV.

-- Target Configurable Fields
SELECT
    oc.name AS column_name,
    oc.column_id,
    oc.type_name,
    oc.capabilities_desc,
    oc.description
FROM sys.dm_xe_packages AS p
INNER JOIN sys.dm_xe_objects AS o
    ON p.guid = o.package_guid
INNER JOIN sys.dm_xe_object_columns AS oc
    ON o.name = oc.OBJECT_NAME
    AND o.package_guid = oc.object_package_guid
WHERE (p.capabilities IS NULL OR p.capabilities & 1 = 0)
  AND (o.capabilities IS NULL OR o.capabilities & 1 = 0)
  AND o.object_type = N'target'
  AND o.name = N'ring_buffer';
In SQL Server 2008, 2008R2, and SQL Server Denali CTP1, the configuration options for the ring buffer are the max_memory option, which sets the maximum amount of memory to be used by the target buffers to hold Event data, and the occurrence_number, which is used to configure the FIFO operation of the target per Event, specifying the number of events by type that the target will retain.

Extended Events Series (5 of 31)   Targets Week   ring buffer   image thumb

Both of the configurable options for the ring_buffer target are optional, and when they are not specified as a part of the Event Session definition, they take on their default values.  As previously stated, the default configuration for the ring_buffer is to use strict FIFO if no value is specified for the occurrence_number in the Event Session.  The default max_memory value is 4MB for the ring_buffer, which is covered in slightly more detail in the Considerations for Usage section of this post.

Understanding the Target Data Format

As previously mentioned, the ring_buffer stores Event data in its raw format.  Inside the Extended Events Engine, the Event data is maintained in a binary format that minimizes the amount of memory necessary to store the Events, maximizing the number of Events that can be stored inside the Targets memory buffers.  The Event data is materialized into an XML document when the Target information is queried using the sys.dm_xe_session_targets DMV, allowing it to be used for Event analysis.  The ring_buffer XML document contains a parent XML <RingBufferTarget> Node that contains attributes about the Targets operation since the Event Session was started including the number of Events processed per second, the amount of time the Target has spent processing Events, the total number of Events that have been processed by the Target, the current number of Events in the target, the number of Events dropped due to full buffers, and the amount of memory used by the Target.

<RingBufferTarget eventsPerSec="" processingTime="" totalEventsProcessed="" eventCount="" droppedCount="" memoryUsed="" />
Inside of the <RingBufferTarget> parent node, are the Event data XML nodes which contain the information returned by the Events defined in the Event Session.  While the XML returned for the Event data does not conform to any published XML Schema, it does have a predictable format based on the Event Session definition.  The root <event> node contains attributes for the Event name, the Package that loaded the Event metadata and that fired the Event for the Event Session, an id associated with the Event, a version associated with the Event, and the timestamp for the date and time in GMT that the Event fired on the server.  Each <event> node will have one or more <data> nodes that contain the information for each of the Event Data Elements returned by the Events default payload.  If Actions have been defined for the Event in the Event Session the <event> node will have an <action> node for each of the Actions that were added to the Event.

The <data> nodes and <action> nodes share a common XML schema, with one exception.  These <data> nodes contain a single attribute containing the name of the Data Element contained by that node, whereas the <action> nodes contain two attributes; one containing the name of the Action contained by that node, and the other the Package for the Action.  Each <data> or <action> node will have a <type> node that contains two attributes; the name of the Type for data type of the value being returned by the parent node, and the Package for the Type.  The <data> or <action> node will also have two additional nodes; a <value> node which contains the value for the data being returned in the Data Element, and a <text> node which will contain the Map lookup text for Data Elements that correspond to Maps in the Extended Events Metadata.  The basic XML definition of an <event> node would be:

<event name="" package="" id="" version="" timestamp="">
  <data name="">
    <type name="" package="" />
    <value />
    <text />
  </data>
  <action name="" package="">
    <type name="" package="" />
    <value />
    <text />
  </action>
</event>
Below is an example Event from the default system_health Event Session that is running on every installation of SQL Server 2008, and SQL Server Denali CTP1 for the wait_info Event.

<event name="wait_info" package="sqlos" id="48" version="1" timestamp="2010-12-03T15:29:00.578Z">
  <data name="wait_type">
    <type name="wait_types" package="sqlos" />
    <value>98</value>
    <text>ASYNC_IO_COMPLETION</text>
  </data>
  <data name="opcode">
    <type name="event_opcode" package="sqlos" />
    <value>1</value>
    <text>End</text>
  </data>
  <data name="duration">
    <type name="uint64" package="package0" />
    <value>44598</value>
    <text />
  </data>
  <data name="max_duration">
    <type name="uint64" package="package0" />
    <value>44598</value>
    <text />
  </data>
  <data name="total_duration">
    <type name="uint64" package="package0" />
    <value>44598</value>
    <text />
  </data>
  <data name="signal_duration">
    <type name="uint64" package="package0" />
    <value>0</value>
    <text />
  </data>
  <data name="completed_count">
    <type name="uint64" package="package0" />
    <value>1</value>
    <text />
  </data>
  <action name="callstack" package="package0">
    <type name="callstack" package="package0" />
    <value>0x0000000001829555
0x0000000000CEA584
0x000000000233FA28
0x0000000002E2FA0C
0x0000000002F10CB9
0x0000000002F112D7
0x0000000002F1B90B
0x0000000002D8C59A
0x0000000000B0F6D2
0x000000000065C59B
0x000000000065C25A
0x000000000065BF35
0x0000000000BE6410
0x0000000000BE64E0
0x0000000000BD87A0
0x0000000000BE5F9F</value>
    <text />
  </action>
  <action name="session_id" package="sqlserver">
    <type name="uint16" package="package0" />
    <value>87</value>
    <text />
  </action>
  <action name="sql_text" package="sqlserver">
    <type name="unicode_string" package="package0" />
    <value>Unable to retrieve SQL text</value>
    <text />
  </action>
</event>
In this Event, the wait_type and opcode Data Elements correspond to the Maps wait_types and opcode respectively, and the text value for the Map that corresponds to the <value> node is in the <text> node.  It is possible to lookup the Maps in the DMV’s separately though not necessary in this example as follows:

SELECT
    p.name AS package_name,
    mv.name AS map_name,
    mv.map_key,
    mv.map_value
FROM sys.dm_xe_packages p
JOIN sys.dm_xe_map_values mv
ON p.guid = mv.object_package_guid
WHERE (p.name = 'sqlos' AND mv.name = 'wait_types')
   OR (p.name = 'sqlos' AND mv.name = 'event_opcode') ;
Querying/Parsing the Target Data

Since the ring_buffer target returns the Event data as XML, obviously we are going to have to do a little bit of work to shred the XML into actionable data using XQuery.  For those new to XQuery, the best I can recommend is to jump over to my good friend Jacob Sebastian’s blog and work your way through his series of XQuery Labs, which have been an amazing resource along my way to learning XQuery.  If you are not interested in learning XQuery, but still want to work with Extended Events, all is not lost.  Adam Machanic wrote the Extended Events Code Generator, which you can use to generate a TSQL statement that will parse out the target data for the ring_buffer, as well as for tomorrows topic, the asynchronous_file_target.  It also includes a SQLCLR helper TVF that optimizes shredding the XML by leveraging the power of .NET that you can optionally deploy in your environment.  Another option is to use the Extended Events SSMS Addin for SQL Server 2008 which includes a TargetDataViewer that shreds the XML for every target available in Extended Events and displays the Event data in a SQL Profiler like GridView inside of SQL Server Management Studio.  Beyond these two tools, you can also use the code available in this blog series.

One of the nuances of working with XML inside of SQL Server, especially with Extended Events, is that sometimes it is better for performance to use a XML variable to hold the XML data for shredding, rather than attempting to shred the XML directly from the DMV’s.  I’ve never quite figured out why this is the case, but it tends to make a bigger impact on larger XML documents, specifically those in the 2MB+ size range.

Since every server running SQL Server 2008, 2008R2, or Denali CTP1 has the system_health session running by default in it, I am going to use that event session to demonstrate how to query the information from the ring_buffer target.  To get the Target data into an XML variable, we’ll need to query the target_data column of the sys.dm_xe_session_targets DMV and CAST the value returned to the XML data type.

DECLARE @target_data XML;
SELECT @target_data = CAST(target_data AS XML)
FROM sys.dm_xe_sessions AS s
JOIN sys.dm_xe_session_targets AS t
    ON t.event_session_address = s.address
WHERE s.name = N'system_health';
With that variable, we can then parse out the Targets header information from the <RingBufferTarget> node attributes:

SELECT
    @target_data.value('(RingBufferTarget/@eventsPerSec)[1]', 'int') AS eventsPerSec,
    @target_data.value('(RingBufferTarget/@processingTime)[1]', 'int') AS processingTime,
    @target_data.value('(RingBufferTarget/@totalEventsProcessed)[1]', 'int') AS totalEventsProcessed,
    @target_data.value('(RingBufferTarget/@eventCount)[1]', 'int') AS eventCount,
    @target_data.value('(RingBufferTarget/@droppedCount)[1]', 'int') AS droppedCount,
    @target_data.value('(RingBufferTarget/@memoryUsed)[1]', 'int') AS memoryUsed;
We can also parse out the individual <event> data nodes from the Target data by using .nodes() method and specifying the XPath to the event nodes and then using .query() method to materialize each node returned by .nodes() as a separate XML document for output.

SELECT
    n.query('.') AS event_data
FROM @target_data.nodes('RingBufferTarget/event') AS q(n);
We can also use an XPath filter in the .nodes() method to query specific Events only

(Note: if your server hasn’t encountered waits that exceed the predicates for the system_health session, this query will not return results).

SELECT
    n.query('.') AS event_data
FROM @target_data.nodes('RingBufferTarget/event[@name=''wait_info'']') AS q(n);
Building on this, we can shred the <event> nodes for the wait_info Events based on the Event definition in the Event Session to turn the XML data into a tabular output that is easier to read.

SELECT
    n.value('(@name)[1]', 'varchar(50)') AS event_name,
    n.value('(@package)[1]', 'varchar(50)') AS package_name,
    n.value('(@id)[1]', 'int') AS id,
    n.value('(@version)[1]', 'int') AS version,
    DATEADD(hh,
            DATEDIFF(hh, GETUTCDATE(), CURRENT_TIMESTAMP),
            n.value('(@timestamp)[1]', 'datetime2')) AS [timestamp],
    n.value('(data[@name="wait_type"]/text)[1]', 'varchar(250)') as wait_type,
    n.value('(data[@name="opcode"]/text)[1]', 'varchar(250)') as opcode,
    n.value('(data[@name="duration"]/value)[1]', 'bigint') as duration,
    n.value('(data[@name="max_duration"]/value)[1]', 'bigint') as max_duration,
    n.value('(data[@name="total_duration"]/value)[1]', 'bigint') as total_duration,
    n.value('(data[@name="completed_count"]/value)[1]', 'bigint') as completed_count,
    n.value('(action[@name="callstack"]/value)[1]', 'varchar(max)') as callstack,
    n.value('(action[@name="session_id"]/value)[1]', 'int') as session_id,
    n.value('(action[@name="sql_text"]/value)[1]', 'varchar(max)') as sql_text
FROM @target_data.nodes('RingBufferTarget/event[@name=''wait_info'']') AS q(n);
Now we could do a lot more actionable work with this data by turning this query into a derived table, or changing it to be a SELECT INTO a temporary table that we query a number of other ways after shredding the XML information.  I’ll leave the possibilities for how to consume this data after shredding the XML up to your imagination, and for another post in this series.

Considerations for Usage

While the ring_buffer target may seem like the ideal Target for short term analysis, there are a number of considerations that must be made in determining whether or not it is the correct Target to use in an Event Session.  The first of these is the number of Events that the Target can actually hold based on the max_memory.  If the Event Session is expected to generate a large quantity of Events, the ring_buffer will probably not meet your needs, depending on the Events definitions in the Event Session.  In addition to this consideration, there is a known issue related to the ring_buffer Target associated with it returning XML through the sys.dm_xe_session_targets DMV as discussed by Bob Ward in his blog post: You may not see the data you expect in Extended Event Ring Buffer Targets….  Essentially, the DMV can only return 4MB of materialized XML, which becomes problematic for a Target that is defined to retain 4MB of Event data in binary form.  The binary representation of the Event data can easily exceed 4MB when materialized as XML for the DMV to output.  When this occurs the output from the DMV is a malformed XML document, as detailed in the Connect item referenced in Bob’s blog post.  According to the the Connect item, this problem has been addressed in SQL Server 2008 Service Pack 2.  In addition to this issue, Adam Machanic filed a slightly different Connect item regarding the failure of the ring_buffer target to return all of the Events captured, which according to the feedback comments is also fixed in SQL Server 2008 Service Pack 2 and SQL Server 2008 R2 Cumulative Update 1.

One of the other considerations for using the ring_buffer Target is that the information captured by an Event Session is memory resident only.  This means that if you are capturing Events in the Event Session that are critical and require persistence in the event of that the SQL Server instance encounters a crash the information captured by the target will not be available when the SQL Server instance restarts.  However, when you are doing analysis of a specific workload while the server is online and available, the ring_buffer can still be useful for capturing Events specific to the workload being analyzed.  To accommodate this, and capture Events and maintain them in a static nature without performing a DROP SESSION on the Event Session, it is necessary to remove the Events from the Event Session by performing an ALTER EVENT SESSION in conjunction with the DROP EVENT DDL command.  To demonstrate this, we can create an Event Session that captures the error_reported Event.

-- Create an Event Session to capture Errors Reported
CREATE EVENT SESSION DemoPersistedEvents
ON SERVER
ADD EVENT sqlserver.error_reported
ADD TARGET package0.ring_buffer
WITH (MAX_DISPATCH_LATENCY = 1 SECONDS);
GO
-- Alter the Event Session and Start it.
ALTER EVENT SESSION DemoPersistedEvents
ON SERVER
STATE=START;
GO
-- SELECT from a non-existent table to create Event
SELECT *
FROM master.schema_doesnt_exist.table_doesnt_exist;
GO
-- Drop the Event to halt Event collection
ALTER EVENT SESSION DemoPersistedEvents
ON SERVER
DROP EVENT sqlserver.error_reported;
GO
-- Wait for Event buffering to Target
WAITFOR DELAY '00:00:01';
GO
-- Create XML variable to hold Target Data
DECLARE @target_data XML;
SELECT @target_data = CAST(target_data AS XML)
FROM sys.dm_xe_sessions AS s
JOIN sys.dm_xe_session_targets AS t
    ON t.event_session_address = s.address
WHERE s.name = N'DemoPersistedEvents'
  AND t.target_name = N'ring_buffer';

-- Query XML variable to get Event Data
SELECT
    @target_data.value('(RingBufferTarget/@eventsPerSec)[1]', 'int') AS eventsPerSec,
    @target_data.value('(RingBufferTarget/@processingTime)[1]', 'int') AS processingTime,
    @target_data.value('(RingBufferTarget/@totalEventsProcessed)[1]', 'int') AS totalEventsProcessed,
    @target_data.value('(RingBufferTarget/@eventCount)[1]', 'int') AS eventCount,
    @target_data.value('(RingBufferTarget/@droppedCount)[1]', 'int') AS droppedCount,
    @target_data.value('(RingBufferTarget/@memoryUsed)[1]', 'int') AS memoryUsed;

SELECT
    n.value('(@name)[1]', 'varchar(50)') AS event_name,
    n.value('(@package)[1]', 'varchar(50)') AS package_name,
    n.value('(@id)[1]', 'int') AS id,
    n.value('(@version)[1]', 'int') AS version,
    DATEADD(hh,
            DATEDIFF(hh, GETUTCDATE(), CURRENT_TIMESTAMP),
            n.value('(@timestamp)[1]', 'datetime2')) AS [timestamp],
    n.value('(data[@name="error"]/value)[1]', 'int') as error,
    n.value('(data[@name="severity"]/value)[1]', 'int') as severity,
    n.value('(data[@name="duration"]/value)[1]', 'int') as state,
    n.value('(data[@name="user_defined"]/value)[1]', 'varchar(5)') as user_defined,
    n.value('(data[@name="message"]/value)[1]', 'varchar(max)') as message
FROM @target_data.nodes('RingBufferTarget/event') AS q(n);
GO
-- Drop the Event Session to cleanup Demo
DROP EVENT SESSION DemoPersistedEvents
ON SERVER;
If your specific requirements allow for the loss of Events due to the FIFO nature of the ring_buffer Target, and you have applied the necessary patches to your SQL Server instance to ensure that invalid XML is not returned by the sys.dm_xe_session_targets DMV, the ring_buffer Target may provide the required functionality for your specific implementation.  When using an Event Session in the short term, or an Event Session that is Predicated to minimize the number of Events that will actually be fired, the ring_buffer is a maintenance free method of collecting raw Event data for further analysis when the Events are dropped from the Event Session to ensure that unnecessary Events are not captured by the Event Session.
The default max_memory value is 4MB for the ring_buffer
asynchronous_file_target? 异步文件目标
Targets Week – asynchronous_file_target
--http://www.sqlskills.com/blogs/jonathan/an-xevent-a-day-6-of-31-targets-week-asynchronous_file_target/
What is the asynchronous_file_target?

The asynchronous_file_target holds the raw format Event data in a proprietary binary file format that persists beyond server restarts and can be provided to another person via ftp or email for remote disconnected analysis of the events.  The asynchronous_file_target has two types of files that are associated with it, the log files which contain the Event data, and the metadata file which contains information about the Events contained in the log files, allowing correct parsing of the log files and the Events and associated Actions contained within them.  Depending on the options configured for the asynchronous_file_target, there may be multiple log files associated with a started Event Session, but there will only be one metadata file created for the duration of that Event Sessions collection.  Subsequent collections by the same Event Session, for example, stopping it and starting it again at a later time, will create a new metadata file associated with that collection by the Event Session.  These files exist as a set and must be maintained together for the log files to be read.

Configuration Options

The asynchronous_file_target like the ring_buffer, has configuration options that can be found in the sys.dm_xe_object_columns DMV.

-- Target Configurable Fields
SELECT
    oc.name AS column_name,
    oc.column_id,
    oc.type_name,
    oc.capabilities_desc,
    oc.description
FROM sys.dm_xe_packages AS p
JOIN sys.dm_xe_objects AS o
    ON p.guid = o.package_guid
JOIN sys.dm_xe_object_columns AS oc
    ON o.name = oc.OBJECT_NAME
    AND o.package_guid = oc.object_package_guid
WHERE (p.capabilities IS NULL OR p.capabilities & 1 = 0)
  AND (o.capabilities IS NULL OR o.capabilities & 1 = 0)
  AND o.object_type = 'target'
  AND o.name = 'asynchronous_file_target'


In SQL Server 2008, 2008R2, and SQL Server Denali CTP1, there are five configuration options for the asynchronous_file_target.  The filename specifies the path and name of the log files and is a required to add the asynchronous_file_target to an Event Session.  The max_file_size option functions the same as SQL Trace maxfilesize option, limiting the size of each file before rollover occurs.  The max_rollover_files option functions the same as the SQL Trace maxrolloverfiles option, specifying the number of rollover files to maintain in the file system, and can be used in conjunction with the max_file_size option to prevent the SQL Server from running out of disk space during Event collection.  The increment option is similar to the AutoGrowth settings for a database in SQL Server, and specifies the size in megabytes that the log files grow, allowing the files to grow incrementally and reducing the number of times a log file has to grow while Events are being dispatched and buffered to the Target.  The metadatafile option specifies the path and name of the metadata file for the target.

An XEvent a Day (6 of 31)   Targets Week   asynchronous file target   image thumb

Notice that the only mandatory option for the file target is the filename for the log files.  When the asynchronous_file_target is used in an Event Session, if the metadatafile option is not explicitly set, the asynchronous_file_target will use the same path and filename specified in the filename option with a .xem extension for the metadata file automatically.

Understanding the Target Data Format

Like the ring_buffer, the asynchronous_file_target stores Event data in its raw format.  Inside the log files, the Event data is maintained in a binary format that minimizes the amount of space necessary to store the Events, maximizing the number of Events that can be stored inside the log files.  Unlike the ring_buffer target however, the asynchronous_file_target is queried not through the sys.dm_xe_session_targets DMV, but through the sys.fn_xe_file_target_read_file() DMF.  The sys.fn_xe_file_target_read_file() DMF requires four input parameters; @path which is the path, filename, and extension mask to the log files, @mdpath which is the path, filename, and extension mask to metadata file, @initial_file_name which is the exact path and filename of a file to start reading from and when specified requires the final parameter @initial_offset which is the offset inside that file from which to begin reading the events.

The sys.fn_xe_file_target_read_file() DMF returns a single row for each instance of Event data that is contained inside of the log files being read.  The Event data is materialized into an XML document in the event_data column output by the DMF.when the Target information is queried using the sys.fn_xe_file_target_read_file() DMF, allowing it to be used for Event analysis.  Like the ring_buffer Target, the Event data returned by the sys.fn_xe_file_target_read_file() DMF is not schema bound, but it has exactly the same XML format as an individual <event> node in the ring_buffer Targets output making it very easy to parse the Events contained in either target with very similar XQuery’s.

Querying/Parsing the Target Data

Since the asynchronous_file_target returns the Event data as XML, we have to do the same type of XQuery work to retrieve the Event data from it as we did with the ring_buffer target from yesterday.  After reading yesterday’s post, Adam Machanic (Blog|Twitter) pointed out in a comment on Twitter that the slow XML parsing is an optimizer bug that is handled with a derived table in his Extended Events Code Generator.  Adam is absolutely correct, and if you attended my session on Extended Events this year at PASS you’d recall that I didn’t have performance issues in my demo’s for querying the Target data generated by my demo’s.  I used a very different parsing method in my PASS demo’s than I showed yesterday, and I plan to cover that method in a later post in this series already.  However, if you want to see the gist of how to work around the performance issue take a look at the code output by Adam’s code generator.

I am going to reuse yesterday’s demo as a basis for looking at the asynchronous_file_target for simplicity as well as to show the similarity of the XQuery used for querying the Event data.  The basic Event Session captures the error_reported Event and to trigger an error performs a SELECT against a non-existent table.

-- Create an Event Session to capture Errors Reported
CREATE EVENT SESSION DemoPersistedEvents
ON SERVER
ADD EVENT sqlserver.error_reported
ADD TARGET package0.ring_buffer,
ADD TARGET package0.asynchronous_file_target(
     SET filename='D:\SQLData\MSSQL10.MSSQLSERVER\MSSQL\Log\DemoPersistedEvents.xel')
WITH (MAX_DISPATCH_LATENCY = 1 SECONDS)
GO
-- Alter the Event Session and Start it.
ALTER EVENT SESSION DemoPersistedEvents
ON SERVER
STATE=START
GO
-- SELECT from a non-existent table to create Event
SELECT *
FROM master.schema_doesnt_exist.table_doesnt_exist
GO
-- Drop the Event to halt Event collection
ALTER EVENT SESSION DemoPersistedEvents
ON SERVER
DROP EVENT sqlserver.error_reported
GO

The first thing we need to know to query our asynchronous_file_target is the filename and metafilename for the files that we want to query from.  If the event session is active and running, we can get this information by querying the Active Session DMV’s.

SELECT
    soc.column_name,
    soc.column_value
FROM sys.dm_xe_sessions s
JOIN sys.dm_xe_session_object_columns soc
    ON s.address = soc.event_session_address
WHERE s.name = 'DemoPersistedEvents'
  AND soc.object_name = 'asynchronous_file_target'
An XEvent a Day (6 of 31)   Targets Week   asynchronous file target   image thumb

Notice that the metatdatafile option is NULL, meaning that we were lazy and didn’t explicitly define the metadata file information in our Event Session so now we have to figure it out in order to query the target data from the log files.  One way to find the information would be to open up the path on the server to the log file that was specified:

An XEvent a Day (6 of 31)   Targets Week   asynchronous file target   image thumb

Notice that the Extended Events Engine automatically created a metadata file with the same name as the log file, but a different extension, .xem.  Also notice that the file names for both the log file and the metadata file have changed from what was actually defined in the Event Session.  The Engine adds a _0_ and a long integer value that represents the number of milliseconds between January 1, 1600 and the date and time that the file was generated by the Extended Events Engine.  Subsequent files will have a different long integer value that is larger in value allowing you to easily sort the log files from oldest to newest or vice versa.  To query the data contained in the log files, you have two options.  First you can explicitly provide the filenames as shown above, or you can use wildcards in the names and the engine will find the correct matching files and begin reading them.

DECLARE @path nvarchar(260), @mdpath nvarchar(260)

-- Get the log file name and substitute * wildcard in
SELECT
    @path = LEFT(column_value, LEN(column_value)-CHARINDEX('.', REVERSE(column_value)))
        + '*'
        + RIGHT(column_value, CHARINDEX('.', REVERSE(column_value))-1)
FROM sys.dm_xe_sessions s
JOIN sys.dm_xe_session_object_columns soc
    ON s.address = soc.event_session_address
WHERE s.name = 'DemoPersistedEvents'
  AND soc.object_name = 'asynchronous_file_target'
  AND soc.column_name = 'filename'

-- Get the metadata file name and substitute * wildcard in
SELECT
    @mdpath = LEFT(column_value, LEN(column_value)-CHARINDEX('.', REVERSE(column_value)))
        + '*'
        + RIGHT(column_value, CHARINDEX('.', REVERSE(column_value))-1)
FROM sys.dm_xe_sessions s
JOIN sys.dm_xe_session_object_columns soc
    ON s.address = soc.event_session_address
WHERE s.name = 'DemoPersistedEvents'
  AND soc.object_name = 'asynchronous_file_target'
  AND soc.column_name = ' metadatafile'

-- Set the metadata filename if it is NULL to the log file name with xem extension
SELECT @mdpath = ISNULL(@mdpath,
                        LEFT(@path, LEN(@path)-CHARINDEX('*', REVERSE(@path)))
                        + '*xem')

-- Query the Event data from the Target.
SELECT
    module_guid,
    package_guid,
    object_name,
    event_data,
    file_name,
    file_offset
FROM sys.fn_xe_file_target_read_file(@path, @mdpath, null, null)


An XEvent a Day (6 of 31)   Targets Week   asynchronous file target   image thumb


The DMF outputs the module_guid, package_guid, and object_name associated with the Event, the event_data as a XML document, but in string format requiring that it be CAST/CONVERT’d to XML for parsing, the file_name of the log file that the Event data was read from and the file_offset inside the file for the event.  Using a CAST to XML and performing a CROSS APPLY of the <event> nodes and the same XQuery’s as in yesterday’s post we can query the Event data from the asynchronous_file_target.

-- Query the Event data from the Target.
SELECT
    n.value('(@name)[1]', 'varchar(50)') AS event_name,
    n.value('(@package)[1]', 'varchar(50)') AS package_name,
    n.value('(@id)[1]', 'int') AS id,
    n.value('(@version)[1]', 'int') AS version,
    DATEADD(hh,
            DATEDIFF(hh, GETUTCDATE(), CURRENT_TIMESTAMP),
            n.value('(@timestamp)[1]', 'datetime2')) AS [timestamp],
    n.value('(data[@name="error"]/value)[1]', 'int') as error,
    n.value('(data[@name="severity"]/value)[1]', 'int') as severity,
    n.value('(data[@name="duration"]/value)[1]', 'int') as state,
    n.value('(data[@name="user_defined"]/value)[1]', 'varchar(5)') as user_defined,
    n.value('(data[@name="message"]/value)[1]', 'varchar(max)') as message
FROM
(SELECT
    CAST(event_data AS XML) AS event_data
 FROM sys.fn_xe_file_target_read_file(@path, @mdpath, null, null)
) as tab
CROSS APPLY event_data.nodes('event') as q(n)

Like the ring_buffer Target, the asynchronous_file_target also has an entry in sys.dm_xe_session_targets, but instead of returning the Event data, it returns information about the targets operation.

select
    target_data.value('(FileTarget/@truncated)[1]', 'int') as truncated,
    target_data.value('(FileTarget/Buffers/@logged)[1]', 'int') as logged,
    target_data.value('(FileTarget/Buffers/@dropped)[1]', 'int') as dropped
FROM
(SELECT CAST(target_data AS XML) AS target_data
FROM sys.dm_xe_sessions AS s
JOIN sys.dm_xe_session_targets AS t
    ON t.event_session_address = s.address
WHERE s.name = 'DemoPersistedEvents'
  AND t.target_name = 'asynchronous_file_target'
) as tab

The file_name and file_offset information in the the sys.fn_xe_file_target_read_file output can be used to perform differential reads from the asynchronous_file_target.  To demonstrate this we can create an Event Session that will capture a lot of Events in a short period of time.

(Note: I wouldn’t create an unfiltered Event Session on the starting and completed events like this on a production server without first evaluating its potential impact.  While this should be safe, if it causes you a problem, its your server not mine.)

IF EXISTS(SELECT * FROM sys.server_event_sessions WHERE name='FileTargetDemo')
    DROP EVENT SESSION [FileTargetDemo] ON SERVER;
CREATE EVENT SESSION [FileTargetDemo]
ON SERVER
ADD EVENT sqlserver.sql_statement_starting,
ADD EVENT sqlserver.sql_statement_completed,
ADD EVENT sqlserver.sp_statement_starting,
ADD EVENT sqlserver.sp_statement_completed,
ADD EVENT sqlserver.rpc_starting,
ADD EVENT sqlserver.rpc_completed,
ADD EVENT sqlserver.module_start,
ADD EVENT sqlserver.module_end
ADD TARGET package0.asynchronous_file_target(
     SET filename='D:\SQLData\MSSQL10.MSSQLSERVER\MSSQL\Log\FileTargetDemo.xel',
         metadatafile='D:\SQLData\MSSQL10.MSSQLSERVER\MSSQL\Log\FileTargetDemo.xem',
         max_file_size = 5,
         max_rollover_files = 5)
WITH(MAX_DISPATCH_LATENCY = 5SECONDS)
GO

-- Start the Event Collection
ALTER EVENT SESSION [FileTargetDemo]
ON SERVER
STATE=STOP
GO

-- Take a pause and allow events to be generated


-- Query the target data from the files.
SELECT
    object_name,
    CAST(event_data as xml) as event_data,
    file_name,
    file_offset
FROM sys.fn_xe_file_target_read_file('D:\SQLData\MSSQL10.MSSQLSERVER\MSSQL\Log\FileTargetDemo*xel',
            'D:\SQLData\MSSQL10.MSSQLSERVER\MSSQL\Log\FileTargetDemo*xem',
            null,
            null)

If you scroll through the output to where the file_offset changes, you can grab the file_name and file_offset for the last event in the first file_offset.

An XEvent a Day (6 of 31)   Targets Week   asynchronous file target   image thumb

Then requery the target passing that file_name and file_offset into the @initial_file_name and @intitial_offset parameters of the sys.fn_xe_file_target_read_file DMF to have the DMF begin reading from the last entry of the provided offset forward.

-- Query the target data from the files.
SELECT
    object_name,
    CAST(event_data as xml) as event_data,
    file_name,
    file_offset
FROM sys.fn_xe_file_target_read_file('D:\SQLData\MSSQL10.MSSQLSERVER\MSSQL\Log\FileTargetDemo*xel',
            'D:\SQLData\MSSQL10.MSSQLSERVER\MSSQL\Log\FileTargetDemo*xem',
            'D:\SQLData\MSSQL10.MSSQLSERVER\MSSQL\Log\FileTargetDemo_0_129360796797990000.xel',
            0)

An XEvent a Day (6 of 31)   Targets Week   asynchronous file target   image thumb

If you’ve run the demo’s in this blog post to this point, don’t forget to cleanup the system.

IF EXISTS(SELECT * FROM sys.server_event_sessions WHERE name='FileTargetDemo')
    DROP EVENT SESSION [FileTargetDemo] ON SERVER;
GO
IF EXISTS(SELECT * FROM sys.server_event_sessions WHERE name='DemoPersistedEvents')
    DROP EVENT SESSION [DemoPersistedEvents] ON SERVER;
GO

Considerations for Usage

The asynchronous_file_target will probably be the preferred target for most people interested in performing long term analysis of Events collected, or performing short term analysis using an Event Session that is expected to generate a large number of events and event loss due to the FIFO nature of the ring_buffer is not acceptable.  However, there are a couple of considerations associated with this target.  The first is that the log files and metadata file are a set, and have to be maintained together.  If you send someone a log file without the metadata file, they won’t be able to read the information contained in the log file.  The second consideration associated with this target is that the only way to read the information contained inside of the log files, as of the date of this blog post being published, is to copy them to a system that is running SQL Server 2008 or 2008R2 and query the files using the there is no way to retrieve the information contained inside of the log files, without querying the sys.fn_xe_file_target_read_file() DMF using TSQL.
--用sys.dm_xe_session_targets来获取ringbuffer里面的数据
DECLARE @target_data XML;
SELECT @target_data = CAST(t.target_data AS XML)
FROM sys.dm_xe_sessions AS s
JOIN sys.dm_xe_session_targets AS t
    ON t.event_session_address = s.address
WHERE s.name = N'DemoPersistedEvents'
  AND t.target_name = N'ring_buffer';

--异步文件使用sys.fn_xe_file_target_read_file() DMF读取xel文件数据
目标:bucketizer 在内存中
Targets Week – bucketizers
--http://www.sqlskills.com/blogs/jonathan/an-xevent-a-day-7-of-31-targets-week-bucketizers/
The bucketizer performs grouping of Events as they are processed by the target into buckets based on the Event data and the Targets configuration.  There are two bucketizer targets in Extended Events; a synchronous_bucketizer and an asynchronous_bucketizer.  The only difference between the two is the manner in which the Event data is processed; either synchronously on the connection that generated the Event, or asynchronously after being dispatched to the target based on the MAX_DISPATCH_LATENCY for the Event Session, or when the dispatch buffer becomes full.  Since the two bucketizers are identical in every way, except for their processing, this blog post will use the asynchronous_bucketizer for all further references.  The bucketizers are a memory resident target, similar to the ring_buffer and like the ring_buffer, only contain the grouped Event data when the Event Session is active.  When the Event Session is stopped, the memory buffers allocated to the bucketizer target are freed and all data contained in the target disappears.  The bucketizer targets can be used to simplify troubleshooting by identifying the events that are occurring the most, and then allowing more focused Event collection for further analysis.  Further analysis could include using either the ring_buffer or the asynchronous_file_target to look at the actual Event data being generated, or changing the bucketizer Targets configuration to group event occurrences based on a different criteria.

Configuration Options

The ring_buffer like most of the targets has configuration options that can be found in the sys.dm_xe_object_columns DMV.

-- Target Configurable Fields
SELECT
    oc.name AS column_name,
    oc.column_id,
    oc.type_name,
    oc.capabilities_desc,
    oc.description
FROM sys.dm_xe_packages AS p
JOIN sys.dm_xe_objects AS o
    ON p.guid = o.package_guid
JOIN sys.dm_xe_object_columns AS oc
    ON o.name = oc.OBJECT_NAME
    AND o.package_guid = oc.object_package_guid
WHERE (p.capabilities IS NULL OR p.capabilities & 1 = 0)
  AND (o.capabilities IS NULL OR o.capabilities & 1 = 0)
  AND o.object_type = 'target'
  AND o.name = 'asynchronous_bucketizer'

In SQL Server 2008, 2008R2, and SQL Server Denali CTP1, there are four configuration options for the asynchronous_bucketizer Target.  The slots option sets the maximum number of buckets the target will collect.  Once this number of buckets is reached, new events that do not apply to an existing bucket are dropped by the target and not grouped.  The filtering_event_name option is used to set the name of the specific Event in the Event Session to filter on.  The source_type option is used to specify whether the source being used for bucketing is a part of the Event data or an Action that has been added to the Events contained in the Event Session.  The source option specifies the source that will be used to generate the buckets for grouping in the target.

An XEvent a Day (7 of 31)   Targets Week   bucketizers   image thumb

As shown above the source is the only required option for the asynchronous_bucketizer Target.  However, when the source is an Action the source_type option is also required to specify that the source is an Action.  When using one of the Event Data elements as the source, only the Data element (also known as a column name) needs to provided to the source.  When using an Action for the source, the Package name must be specified along with the Action name in the format of packagename.actionname.  Likewise when specifying a filtering_event_name, the Package name must also be provided in the format of packagename.eventname.

Understanding the Target Data Format

The bucketizer Targets like the other Targets already output the data in XML format, and the XML is not schema bound, but has a predictable format.  Inside the Extended Events Engine, the bucketing data is maintained in a binary format that minimizes the amount of memory necessary for the Targets memory buffers.  The bucketing data is materialized into an XML document when the Target information is queried using the sys.dm_xe_session_targets DMV, allowing it to be used for analysis.  The asynchronous_bucketizer XML document contains a parent XML <BucketizerTarget> Node that contains attributes about the Targets operation since the Event Session was started including the number of truncated Events and the maximum number of buckets contained in the Target.  The bucket groups are contained in <Slot> nodes that have two attributes; the count is the number of events that have occurred and the trunc is the number of bytes that have been truncated.  The <Slot> node contains a <value> node that contains the source that the bucket belongs to.  A simplified representation of the XML document for the asynchronous_bucketizer target is:

<BucketizerTarget truncated="" buckets="">
  <Slot count="" trunc="">
    <value></value>
  </Slot>
</BucketizerTarget>
Querying/Parsing the Target Data

The asynchronous_bucketizer targets simplistic XML output makes querying it relatively simple compared to the targets that we’ve already looked at this week.  However, unlike the other ring_buffer and asychronous_file_target, the asychronous_bucketizer can not be parsed using Adam Machanic’s Extended Events Code Generator.  The simplicity of the XML and its standard output doesn’t really require specialized code to generate a easily usable table output for this.  The Extended Events SSMS Addin for SQL Server 2008  TargetDataViewer will shred the XML but its not even worth using for this particular target, since the XQuery is very simple, and you can do a lot more with the TSQL depending on the Event Session that your create.  To demonstrate the usage of the asynchronous_bucketizer, we’ll look at a couple of examples.  The first example will show how to track recompiles by database_id to find the databases that have the most recompiles occurring.

-- Create an Event Session to Track Recompiles
IF EXISTS(SELECT * FROM sys.server_event_sessions WHERE name='BucketizerTargetDemoRecompiles')
    DROP EVENT SESSION [BucketizerTargetDemoRecompiles] ON SERVER;
CREATE EVENT SESSION [BucketizerTargetDemoRecompiles]
ON SERVER
ADD EVENT sqlserver.sql_statement_starting
(    ACTION (sqlserver.database_id) -- database_id to bucket on
     WHERE (state=1) -- recompile state from dm_xe_map_values
),
ADD EVENT sqlserver.sp_statement_starting
(    ACTION (sqlserver.database_id) -- database_id to bucket on
     WHERE (state=1) -- recompile state from dm_xe_map_values
)
ADD TARGET package0.asynchronous_bucketizer
(     SET source_type=1, -- specifies bucketing on Action
         source='sqlserver.database_id' -- Action to bucket on
)
WITH (MAX_DISPATCH_LATENCY = 5 SECONDS)
GO
ALTER EVENT SESSION [BucketizerTargetDemoRecompiles]
ON SERVER
STATE=START
The above session collects the sql_statement_starting and sp_statement_starting Events, adds the database_id Action to the Event so that we can bucket on it, and then filters the Events to only fire if the state for the Event matches the map_key in sys.dm_xe_map_values for Recompile.  If the server being tested on doesn’t have a high recompile rate, an easy way to trigger Recompiles is to update the statistics on the tables inside of a database.

EXECUTE sp_MSforeachtable 'UPDATE STATISTICS ?'
To view the bucketized data from the target, we query sys.dm_xe_session_targets for our session and target using CAST to convert the target_data to XML in a derived table, and then using a CROSS APPLY of the .node() method to split on the <Slot> nodes.

SELECT
    DB_NAME(n.value('(value)[1]', 'int')) AS DatabaseName,
    n.value('(@count)[1]', 'int') AS EventCount,
    n.value('(@trunc)[1]', 'int') AS EventsTrunc
FROM
(SELECT CAST(target_data as XML) target_data
FROM sys.dm_xe_sessions AS s
JOIN sys.dm_xe_session_targets t
    ON s.address = t.event_session_address
WHERE s.name = 'BucketizerTargetDemoRecompiles'
  AND t.target_name = 'asynchronous_bucketizer') as tab
CROSS APPLY target_data.nodes('BucketizerTarget/Slot') as q(n)

With the <Slot> nodes split, pulling the <value> node and attributes is very simple, and since we bucketed on database_id, we can use the DB_NAME() function in SQL to return the database name associated with the database_id in the <value> node.

Considerations for Usage

The bucketizer targets are great for simplifying analysis of Event data to determine who to best proceed with further troubleshooting.  However, in SQL Server 2008, and 2008R2 a bug exists that causes incorrect output from the bucketizers when used to bucket on the wait_info event wait_type Data element.  This was fixed in SQL Server 2008 Service Pack 2 (http://support.microsoft.com/kb/2285068), and is not a problem in SQL Server Denali CTP1, but as of this writing has yet to be corrected in SQL Server 2008 R2 (at least the CU’s I have tested, there may be a newer one that I have missed, but I didn’t find one in a search).  To demonstrate this problem the following Event Session can be used:

IF EXISTS(SELECT * FROM sys.server_event_sessions WHERE name='BucketizerTargetDemoWaits')
    DROP EVENT SESSION [BucketizerTargetDemoWaits] ON SERVER;
CREATE EVENT SESSION [BucketizerTargetDemoWaits]
ON SERVER
ADD EVENT sqlos.wait_info
(    ACTION (sqlserver.database_id)
    WHERE (duration > 0))
ADD TARGET package0.asynchronous_bucketizer(
     SET filtering_event_name='sqlos.wait_info', source_type=0, source='wait_type')
WITH (MAX_DISPATCH_LATENCY = 5 SECONDS)
GO
ALTER EVENT SESSION [BucketizerTargetDemoWaits]
ON SERVER
STATE=START

The above Event Session will return valid map_key values for the wait_types Map in sys.dm_xe_map_values on SQL Server 2008 Service Pack 2 and SQL Server Denali CTP1, but will have erroneous information in the <value> node on SQL Server 2008 RTM and SP1 and SQL Server 2008 R2.  To query the bucketed waits from the target, use the following query:

SELECT
    mv.map_value AS WaitType,
    n.value('(@count)[1]', 'int') AS EventCount,
    n.value('(@trunc)[1]', 'int') AS EventsTrunc,
    n.value('(value)[1]', 'int') AS MapKey
FROM
(SELECT CAST(target_data as XML) target_data
FROM sys.dm_xe_sessions AS s
JOIN sys.dm_xe_session_targets t
    ON s.address = t.event_session_address
WHERE s.name = 'BucketizerTargetDemoWaits'
  AND t.target_name = 'asynchronous_bucketizer') as tab
CROSS APPLY target_data.nodes('BucketizerTarget/Slot') as q(n)
JOIN sys.dm_xe_map_values as mv
    ON mv.map_key = n.value('(value)[1]', 'int')
WHERE mv.name = 'wait_types'
更新所有表的统计信息使所有SQL语句重编译
EXECUTE sp_MSforeachtable 'UPDATE STATISTICS ?'
synchronous_event_counter 同步事件计数器 内存中
Targets Week – synchronous_event_counter
--http://www.sqlskills.com/blogs/jonathan/an-xevent-a-day-8-of-31-targets-week-synchronous_event_counter/
统计事件触发的次数 存储在内存里
Yesterday’s post, Targets Week – Bucketizers, looked at the bucketizer Targets in Extended Events and how they can be used to simplify analysis and perform more targeted analysis based on their output.  Today’s post will be fairly short, by comparison to the previous posts, while we look at the synchronous_event_counter target, which can be used to test the impact of an Event Session without actually incurring the cost of Event collection.

What is the synchronous_event_counter?

The synchronous_event_count simply put, is a Target that counts the number of Events that fire for a given Event Session.  It can be used to test whether or not the defined Predicates on Events in an Event Session perform the level of filtering expected, without having to actually perform full Event collection using one of the raw Event data targets like the ring_buffer or asynchronous_file_target.  The Target is synchronous however, due to the fact that it only counts the number of times each Event fires, its impact is minimized in comparison to the other synchronous targets available.  Like the ring_buffer and bucketizer, the synchronous_event_counter Target is a memory resident Target that holds event data in memory while the Event Session is active on the SQL Server.  When the Event Session is stopped, the memory buffers allocated to the synchronous_event_counter target are freed and any information contained in the target is lost.

Configuration Options

There are no configuration options for the synchronous_event_counter Target. (see I said this was going to be a short post comparatively).

 -- Target Configurable Fields
SELECT
   oc.name AS column_name,
   oc.column_id,
   oc.type_name,
   oc.capabilities_desc,
   oc.description
FROM sys.dm_xe_packages AS p
JOIN sys.dm_xe_objects AS o
    ON p.guid = o.package_guid
JOIN sys.dm_xe_object_columns AS oc
    ON o.name = oc.OBJECT_NAME
   AND o.package_guid = oc.object_package_guid
WHERE(p.capabilities IS NULL OR p.capabilities & 1 = 0)
  AND (o.capabilities IS NULL OR o.capabilities & 1 = 0)
  AND o.object_type = 'target'
  AND o.name = 'synchronous_event_counter'

An XEvent a Day (8 of 31)   Targets Week   synchronous event counter   image thumb

Understanding the Target Data Format

Like the ring_buffer and bucketizer Targets, the synchronous_event_counter Target returns its information by querying the sys.dm_xe_session_targets DMV, and it returns the Target data in an XML format that is not schema bound, but that has a standardized format.  The synchronous_event_counter Target has a very simple XML document, much like the bucketizer Targets.  The root node of the XML is the <CounterTarget> node which has a child node <Packages> which has a child <Package> node for each package that identifies the package using an @name attribute.  Each <Package> node will have one or more <Event> nodes based on the number of Events defined in the Event Session for that particular package.  The <Event> nodes each will contain two attributes, the name of the event and the count for its occurrence since the Event Session started.  A simplified representation of the XML output by the synchronous_event_counter Target is below:

<CounterTarget truncated="">
  <Packages>
    <Package name="">
      <Event name="" count="" />
    </Package>
  </Packages>
</CounterTarget>

Querying/Parsing the Target Data

Like the other memory resident Targets in Extended Events, the synchronous_event_counter Target data is only exposed by querying the sys.dm_xe_session_targets DMV.  The following example will demonstrate how the synchronous_event_counter can be used to test the number of Events that an Event Session will generate:

-- Create an Event Session to Track Recompiles
IF EXISTS(SELECT * FROM sys.server_event_sessions WHERE name='CounterTargetDemo')
    DROP EVENT SESSION [CounterTargetDemo] ON SERVER;
CREATE EVENT SESSION [CounterTargetDemo]
ON SERVER
ADD EVENT sqlserver.sql_statement_starting,
ADD EVENT sqlos.wait_info
(    WHERE (duration > 0))
ADD TARGET package0.synchronous_event_counter
GO

-- Start the Event Session
ALTER EVENT SESSION [CounterTargetDemo]
ON SERVER
STATE=STOP
GO

-- Wait for Events to generate and then Query Target

-- Query the Target
SELECT
    n.value('../@name[1]', 'varchar(50)') as PackageName,
    n.value('@name[1]', 'varchar(50)') as EventName,
    n.value('@count[1]', 'int') as Occurence
FROM
(
SELECT CAST(target_data AS XML) as target_data
FROM sys.dm_xe_sessions AS s
JOIN sys.dm_xe_session_targets AS t
    ON t.event_session_address = s.address
WHERE s.name = 'CounterTargetDemo'
  AND t.target_name = 'synchronous_event_counter'
) as tab
CROSS APPLY target_data.nodes('CounterTarget/Packages/Package/Event') as q(n)

-- Drop the Event Session
IF EXISTS(SELECT * FROM sys.server_event_sessions WHERE name='CounterTargetDemo')
    DROP EVENT SESSION [CounterTargetDemo] ON SERVER;

This session on one of my test servers generated the following output while running for less than five seconds:

An XEvent a Day (8 of 31)   Targets Week   synchronous event counter   image thumb

Based on this number of Events being fired, it may be determined that the predicates for the session need to provide further filtering of the Events, or if it is determined that the Predicates are filtering the Events as intended, this at least lets us know that the number of Events firing will require the use of the asynchronous_file_target, if the plan is to look at the Events raw data.

Considerations for Usage

The only real consideration associated with the synchronous_event_counter Target is that it is an synchronous Target.  However, since it is only counting the occurrences of the Events defined in the Event Session and is not actually buffering the data for dispatch its impact is not generally a concern.
目标:pair_matching 内存中
Targets Week – pair_matching
--http://www.sqlskills.com/blogs/jonathan/an-xevent-a-day-9-of-31-targets-week-pair_matching/
Yesterday’s post, Targets Week – synchronous_event_counter, looked at the counter Target in Extended Events and how it could be used to determine the number of Events a Event Session will generate without actually incurring the cost to collect and store the Events.  Today’s post is coming late, I know, but sometimes that’s just how the ball rolls.  My original planned demo’s for today’s post turned out to only work based on a fluke, though they were very consistent at working as expected, and as a result I had to rework a lot of this post this evening instead of letting it auto-post in the morning.  Today’s post will cover the pair_matching Target, which can be used to find Events that didn’t have a corresponding matching Event based on the Targets configuration.

What is the pair_matching Target?

The pair_matching Target works by matching a Begin Event with an End Event based on the specified match Columns and Actions, and drops the matched pairs of Events from the Target so that only unmatched Events remain.   However, life would be grand if it was only that simple to use.  The Books Online example How to: Determine Which Queries Are Holding Locks, uses the pair_matching Target with the sqlserver.lock_acquired and sqlserver.lock_released events for matching, to try and show how to find queries that haven’t released their Locks.  The problem is, there is not a 1:1 relationship between lock_acquired and lock_released Events.  Lock escalation can kick in and multiple granular locks are acquired but the escalation to a less granular Lock only requires a single lock_released Event to fire.

In the Using SQL Server 2008 Extended Events whitepaper I wrote, I showed how to track down orphaned transactions using the sqlserver.database_transaction_begin and sqlserver.database_transaction_end Events and matching on the sqlserver.session_id Action.  The reason that this example works is that only one explicit transaction can be open for an session_id, even if you issue multiple BEGIN TRANSACTION commands, a single ROLLBACK undoes every operation performed since the first BEGIN TRANSACTION.  Yes this is a tangent, but fear not, I am coming back to why this matters to the pair_matching Target.  It matters to the pair_matching target because the begin and end Events must uniquely match each other in a manner that is 1:1 or the pair_matching Target is not going to work as you expect it to, as in the “Which Queries Are Holding Locks” example in the BOL.

Like the ring_buffer, bucketizer, and the synchronous_event_counter, the pair_matching Target is a memory resident Target that holds event data in memory while the Event Session is active on the SQL Server.  When the Event Session is stopped, the memory buffers allocated to the target are freed and any information contained in the target is lost.

Configuration Options

There are seven configuration options for the pair_matching Target, with two of them being mandatory.  The pair_matching Target requires that the begin_event and end_event for matching be specified for the Target.  In addition to specifying the events, it is also possible to restrict the match criteria by specifying an ordered comma separated list of column names for the begin_matching_columns and end_matching_columns configuration options.  If the matching requires the use of Actions, an ordered comma separated list of Action names in the format of <package_name.action_name> can be specified for the begin_matching_actions and end_matching_actions configuration options.  The final configuration option respond_to_memory_pressure determines whether or not the Target responds to memory pressure, and stops adding new orphaned events when there is memory pressure in the SQL Server.

-- Target Configurable Fields
SELECT
   oc.name AS column_name,
   oc.column_id,
   oc.type_name,
   oc.capabilities_desc,
   oc.description
FROM sys.dm_xe_packages AS p
JOIN sys.dm_xe_objects AS o
    ON p.guid = o.package_guid
JOIN sys.dm_xe_object_columns AS oc
    ON o.name = oc.OBJECT_NAME
   AND o.package_guid = oc.object_package_guid
WHERE(p.capabilities IS NULL OR p.capabilities & 1 = 0)
  AND (o.capabilities IS NULL OR o.capabilities & 1 = 0)
  AND o.object_type = 'target'
  AND o.name = 'pair_matching'

An XEvent a Day (9 of 31)   Targets Week   pair matching   image thumb

Understanding the Target Data Format

Like the other memory resident Targets, the pair_matching Target returns its information by querying the sys.dm_xe_session_targets DMV, and it returns the Target data in an XML format that is not schema bound, but that has a standardized format.  The pair_matching Target XML document, closely matches the output of the ring_buffer Target.  The root node of the XML is the <PairingTarget> node which has attributes for the number of truncated Events, the count of the current number of orphans held in the Target, the number of matched Event pairs that have been made by the Target, and the number of orphans that have been dropped due to memory pressure in SQL Server.  The <PairingTarget> node has child <event> nodes that match the XML document of the <event> nodes in the ring_buffer and asynchronous_file_target Targets.  A simplified representation of the XML output by the pair_matching Target is below:

<PairingTarget truncated="" orphanCount="" matchedCount="" memoryPressureDroppedCount="">
  <event name="" package="" id="" version="" timestamp="">
    <data name="">
      <type name="" package="" />
      <value />
      <text />
    </data>
    <action name="" package="">
      <type name="" package="" />
      <value />
      <text />
    </action>
  </event>
</PairingTarget>

Querying/Parsing the Target Data

Like the other memory resident Targets in Extended Events, the pair_matching Target data is only exposed by querying the sys.dm_xe_session_targets DMV.  Mike Wachal at Microsoft, traded emails with me, and dug into the source code for the pair_matching target yesterday trying to help me with some questions for this post, especially as they related to the legitimacy of the demo’s being planned for this post.  In the end Mike sent me a demo and permission to post it here in lieu of the questionable ones that I had been trading emails with him about.  It is with much appreciation to Mike and the Extended Events Development team for their assistance with this blog post and the consistent back and forth with emails that they provided yesterday.

Mike provided an example that I will show in its entirety for this weeks wrap up post on Saturday, but I am going to show a shorter sample of the demo to show how to use the pair_matching Target and query the Target data from it.  When SQL Server executes a statements, generally the sqlserver.sql_statement_starting Event is fired when the statement begins executing and the sqlserver.sql_statement_completed Event is fired when the statement completes.  However, when the client sets an execution time, also known as a CommandTimeout in .NET, if the execution duration exceeds that timeout, the statement never completes inside of SQL Server.  I have run into problems with the default timeout of 30 seconds in .NET more times than I ever care to think about in my career.

To demonstrate a execution time out using SQL Server Management Studio, you can open a New Query window, and in the connection dialog click on the Connection Properties tab and change the Execution time-out option from 0 (zero) to a positive integer value.  For the purposes of this blog post example, I am going to use 5 seconds as the execution timeout for one query window that will generate the unmatched event.

An XEvent a Day (9 of 31)   Targets Week   pair matching   image thumb

The first thing we need to do is setup our Event Session to capture our Events and Actions, and configure our pair_matching Target.

-- Create the Event Session
CREATE EVENT SESSION FindAttentionEvents
ON SERVER
ADD EVENT sqlserver.sql_statement_starting
(    ACTION(sqlserver.session_id, sqlserver.tsql_stack)
),
ADD EVENT sqlserver.sql_statement_completed
(    ACTION(sqlserver.session_id, sqlserver.tsql_stack)
)
ADD TARGET package0.pair_matching
(    SET begin_event = 'sqlserver.sql_statement_starting',
        begin_matching_actions = 'sqlserver.session_id, sqlserver.tsql_stack',
        end_event = 'sqlserver.sql_statement_completed',
        end_matching_actions = 'sqlserver.session_id, sqlserver.tsql_stack',
        respond_to_memory_pressure = 0
)
WITH (MAX_DISPATCH_LATENCY=5 SECONDS, TRACK_CAUSALITY=ON)

-- Start the Event Session
ALTER EVENT SESSION FindAttentionEvents
ON SERVER
STATE=START
GO
Now in the New Query window that had the connection option for execution timeout set to 5 seconds, run the following commands:

SELECT TOP 100 *
FROM sys.objects
GO

SELECT TOP 100 *
FROM sys.columns
GO

WAITFOR DELAY '00:00:10'
GO
In my test system the output for this is:

An XEvent a Day (9 of 31)   Targets Week   pair matching   image thumb

If we flip back to a normal Query window and query the Target data, we will see multiple matched Events and one orphaned Event, for the above failure.

-- Create XML variable to hold Target Data
DECLARE @target_data XML
SELECT @target_data =
    CAST(target_data AS XML)
FROM sys.dm_xe_sessions AS s
JOIN sys.dm_xe_session_targets AS t
    ON t.event_session_address = s.address
WHERE s.name = 'FindAttentionEvents'
  AND t.target_name = 'pair_matching'

-- Query XML variable to get Target Execution information
SELECT
    @target_data.value('(PairingTarget/@orphanCount)[1]', 'int') AS orphanCount,
    @target_data.value('(PairingTarget/@matchedCount)[1]', 'int') AS matchedCount,
    @target_data.value('(PairingTarget/@memoryPressureDroppedCount)[1]', 'int') AS memoryPressureDroppedCount

-- Query the XML variable to get the Target Data
SELECT
    n.value('(event/@name)[1]', 'varchar(50)') AS event_name,
    n.value('(event/@package)[1]', 'varchar(50)') AS package_name,
    n.value('(event/@id)[1]', 'int') AS id,
    n.value('(event/@version)[1]', 'int') AS version,
    DATEADD(hh,
            DATEDIFF(hh, GETUTCDATE(), CURRENT_TIMESTAMP),
            n.value('(event/@timestamp)[1]', 'datetime2')) AS [timestamp],
    n.value('(event/data[@name="source_database_id"]/value)[1]', 'int') as [source_database_id],
    n.value('(event/data[@name="object_id"]/value)[1]', 'int') as [object_id],
    n.value('(event/data[@name="object_type"]/value)[1]', 'varchar(60)') as [object_type],
    n.value('(event/data[@name="state"]/text)[1]', 'varchar(50)') as [state],
    n.value('(event/data[@name="offset"]/value)[1]', 'int') as [offset],
    n.value('(event/data[@name="offset_end"]/value)[1]', 'int') as [offset_end],
    n.value('(event/data[@name="nest_level"]/value)[1]', 'int') as [nest_level],
    n.value('(event/action[@name="session_id"]/value)[1]', 'int') as session_id,
    n.value('(event/action[@name="tsql_stack"]/value)[1]', 'varchar(max)') as tsql_stack,
    n.value('(event/action[@name="attach_activity_id"]/value)[1]', 'varchar(50)') as activity_id
FROM
(    SELECT td.query('.') as n
FROM @target_data.nodes('PairingTarget/event') AS q(td)
) as tab
ORDER BY session_id, activity_id
GO
If you pay close attention to the above XQuery of the Target data, you should catch that there is a difference between the above and previous examples.  I have a prize for the first person that is not Adam Machanic (sorry dude, but you told me about it so that would be unfair) to comment with what that difference is and why it is important to take note of.  The output of the above query on my test system after running the demo is:

An XEvent a Day (9 of 31)   Targets Week   pair matching   image thumb

Now with this Demo, it is important that you reset the environment that you tested it in if you followed the instructions and changed the execution timeout in SQL Server Management Studio.  If you don’t change it back, you will try and run a query that takes longer than 5 seconds and it will timeout on you.  Also don’t forget to cleanup the Event Session by dropping it from the catalog.

-- Cleanup from the demonstration
DROP EVENT SESSION FindAttentionEvents
ON SERVER

Considerations for Usage

The pair_matching Target can be a very useful tool in finding unmatched Events, but as previously pointed out in this blog post, you have to be very careful what you are providing for match criteria, and the Events have to have a 1:1 correlation for the begin_event and end_event or the target will produce incorrect results.
etw_classic_sync_target etw经典同步目标
Targets Week – etw_classic_sync_target
--http://www.sqlskills.com/blogs/jonathan/an-xevent-a-day-10-of-31-targets-week-etw_classic_sync_target/
默认的ETW会话文件保存在%TEMP%\XEEtw.etl
对于一般故障排除,etw_classic_sync_target不应考虑选择的目标
What is the etw_classic_sync_target Target?

The etw_classic_sync_target Target is the target that hooks Extended Events in SQL Server into Event Tracing for Windows (ETW).  Event Tracing for Windows is a general purpose, high speed tracing mechanism provided by the Windows Server OS that allows for in-depth analysis and correlation of events from multiple applications, as well as the Windows Kernel.  ETW was first introduced in Windows Server 2000, was then expanded on in Windows Server 2003, and Windows Server 2008 and Windows Server 2008 R2 built significantly on the ETW tracing available in the OS.  For a background on ETW as a concept, I’d recommend that you read Event Tracing: Improve Debugging And Performance Tuning With ETW.

It might surprise you to know that ETW integration with SQL Server wasn’t entirely new in Extended Events.  The first integration with ETW actually occurred in SQL Server 2005 and was talked about on the SQL Query Processing Team’s blog post Using ETW for SQL Server 2005 back in 2006.  The ETW integration in SQL Server 2005 was trace based integration, and is similar to as well as different from the ETW integration that exists through Extended Events.  There are two providers available currently in ETW in the Windows Server OS, a classic provider (Windows Server 2000 and newer), and a manifest based provider (Windows Vista and Server 2008 and newer) (http://msdn.microsoft.com/en-us/library/aa363668(VS.85).aspx#providers).  The etw_classic_sync_target uses the classic provider for buffering events to ETW to ensure that backwards compatibility is maintained for the supported Operating Systems that SQL Server can run on.

Unlike the other targets available in Extended Events, the output of the etw_classic_sync_target is not available inside of SQL Server through a DMV or even by querying a DMF, since the events are buffered to ETW which is an OS based mechanism.  Currently, there can only be one ETW Session for Extended Events at a time, and that session is named XE_DEFAULT_ETW_SESSION.  The XE_DEFAULT_ETW_SESSION is created the first time a ETW Target is registered in an Event Session and is reused by subsequent Event Sessions that register an ETW Target in SQL Server.  If multiple Event Sessions utilize the etw_classic_sync_target on a server, even if they exist in multiple instances of SQL Server, the Events fired by the Event Sessions all use the XE_DEFAULT_ETW_SESSION session in ETW.  This makes isolation of Events to single instance impossible under the current design unless the Event Sessions are run independently instead of concurrently.

Unlike the other Targets available in Extended Events, the ETW session created the first time that the etw_classic_sync_target is registered in an active Event Session is not removed when the etw_classic_sync_target is dropped from the Event Session, or when the Event Session is stopped.  The only way to remove the XE_DEFAULT_ETW_SESSION is with command line commands to one of the ETW consumers available in Window; either logman or xperf if installed.  Also in contrast to the other targets, the XE_DEFAULT_ETW_SESSION requires manual flushing to ensure that Events are processed before removing the XE_DEFAULT_ETW_SESSION ETW session in the OS.

Configuration Options

There are five configuration options for the etw_classic_sync_target Target in Extended Events.  All of the configuration options are optional.  The default_etw_session_logfile_path can be used to specify the path to the log file created by the ETW Session for logging the Events.  Once this file path has been set, it can not be changed while the XE_DEFAULT_ETW_SESSION ETW session exists in Windows, the default file location is %TEMP%\XEEtw.etl.  If you are utilizing the etw_classic_sync_target Target in multiple Event Sessions or multiple Instance of SQL Server on the same OS, it is important to maintain consistency in the definition of this option.  The default_etw_session_buffer_size_kb specifies the default size of the in-memory buffers for the ETW session, the default buffer size is 128KB.  The default_etw_session_logfile_size_mb specifies the size of the file used to store the events sent to the ETW session, the default size is 20MB.  The retries option specifies the number of attempts that the Extended Event Engine will retry publishing the events to the ETW Session if the initial attempt to publish the events fails, the default value is 0 retry attempts, meaning that the Event will be dropped if they fail on the first attempt.  The default_xe_session_name specifies the name of the ETW session to create in the ETW subsystem for the Event Session, the default is XE_DEFAULT_ETW_SESSION.

-- Target Configurable Fields
SELECT
   oc.name AS column_name,
   oc.column_id,
   oc.type_name,
   oc.capabilities_desc,
   oc.description
FROM sys.dm_xe_packages AS p
JOIN sys.dm_xe_objects AS o
    ON p.guid = o.package_guid
JOIN sys.dm_xe_object_columns AS oc
    ON o.name = oc.OBJECT_NAME
   AND o.package_guid = oc.object_package_guid
WHERE(p.capabilities IS NULL OR p.capabilities & 1 = 0)
  AND (o.capabilities IS NULL OR o.capabilities & 1 = 0)
  AND o.object_type = 'target'
  AND o.name = 'etw_classic_sync_target'


An XEvent a Day (10 of 31)   Targets Week   etw classic sync target   image thumb

Understanding the Target Data Format

Unlike the other Targets in Extended Events, that etw_classic_sync_target Target data format depends on a number of factors, specifically on which ETW consumer, and what options are specified for the consumer for exporting the information into a user consumable format.  To be perfectly honest as much as I have played with the etw_classic_sync_target, I have yet to figure out all of the possible options for consuming the ETW session data that can be generated.  There are a number of available tools for consuming ETW session data, including logman, tracerpt, and xperf.

A wide variety of output formats is possible including text, CSV, and XML, and when using Windows Vista or Windows Server 2008 as the system of analysis, xperfview can be be used to provide a graphical output of the ETW session data from from the .etl file.  For this reason I will not attempt to cover all of the formats available for consuming ETW session information, but will instead leave that up to the reader to investigate.

Querying/Parsing the Target Data

One of the topics not yet covered in this series is the fact that inside of Extended Events in SQL Server, every Event has an associated Channel and Keyword associated with it that maps to a Channel and Keyword in ETW.  Inside of ETW, the channel defines the intended audience for the Event, and the Keyword provides an application specific grouping of events.  This information can be queried from the sys.dm_xe_object_columns DMV by joining it to the sys.dm_xe_map_values DMV as follows:

-- Event ETW Keyword/Channel pairings
SELECT
    package_name,
    object_name,
    CHANNEL as channel_name,
    KEYWORD as keyword_name
FROM
(
SELECT
    p.name AS package_name,
    o.name AS object_name,
    oc.name AS column_name,
    mv1.map_value
FROM sys.dm_xe_packages p
JOIN sys.dm_xe_objects o
    ON p.guid = o.package_guid
JOIN sys.dm_xe_object_columns oc
    ON o.package_guid = oc.object_package_guid
        AND o.name = oc.object_name
LEFT JOIN sys.dm_xe_map_values mv1
    on oc.type_name = mv1.name
        and oc.column_value = mv1.map_key
WHERE oc.name IN ('CHANNEL', 'KEYWORD')
    -- Filter out private internal use only objects
  AND (p.capabilities IS NULL OR p.capabilities & 1 = 0)
  AND (o.capabilities IS NULL OR o.capabilities & 1 = 0)
  AND (oc.capabilities IS NULL OR oc.capabilities & 1 = 0)
) AS tab
PIVOT
(
    MAX(map_value)
    FOR column_name IN ([CHANNEL], [KEYWORD])
) as pvt
ORDER BY CHANNEL, KEYWORD, package_name, object_name


When planning Event Sessions in general, using the Channels and Keywords of Events to identify events of interest can be very useful, especially when first learning Extended Events.  In relation to ETW, they provide the integration


IF EXISTS(SELECT *
         FROM sys.server_event_sessions
         WHERE name='etw_test_session')
    DROP EVENT SESSION [etw_test_session] ON SERVER;
CREATE EVENT SESSION [etw_test_session]
ON SERVER
ADD EVENT sqlserver.file_read(
     ACTION (sqlserver.database_id, sqlserver.session_id)),
ADD EVENT sqlserver.file_read_completed(
     ACTION (sqlserver.database_id, sqlserver.session_id)),
ADD EVENT sqlos.async_io_requested(
     ACTION (sqlserver.database_id, sqlserver.session_id)),
ADD EVENT sqlos.async_io_completed(
     ACTION (sqlserver.database_id, sqlserver.session_id)),
ADD EVENT sqlos.wait_info(
     ACTION (sqlserver.database_id, sqlserver.session_id)),
ADD EVENT sqlserver.sql_statement_starting(
     ACTION (sqlserver.database_id, sqlserver.plan_handle,
            sqlserver.session_id, sqlserver.sql_text)),
ADD EVENT sqlserver.sql_statement_completed(
     ACTION (sqlserver.database_id, sqlserver.plan_handle,
            sqlserver.session_id, sqlserver.sql_text))
-- ADD ETW target
ADD TARGET package0.etw_classic_sync_target (
       SET default_etw_session_logfile_path = N'C:\SQLBlog\sqletwtarget.etl')
WITH (MAX_MEMORY = 4096KB,
     EVENT_RETENTION_MODE = ALLOW_SINGLE_EVENT_LOSS,
     MAX_DISPATCH_LATENCY = 5 SECONDS,
     MAX_EVENT_SIZE = 4096KB,
     MEMORY_PARTITION_MODE = PER_CPU,
     TRACK_CAUSALITY = ON,
     STARTUP_STATE = OFF)
GO

This Event Session will capture SQL statements from start to complete as well as the file read operations performed by the database engine to satisfy the request.  To get the OS Kernel information using ETW we will need to start a Kernel

logman start "NT Kernel Logger" /p "Windows Kernel Trace" (process,thread,disk) /o C:\SQLBlog\systemevents.etl /ets

An XEvent a Day (10 of 31)   Targets Week   etw classic sync target   image thumb

With the NT Kernel Logger started and capturing kernel level process, thread, and disk events into the systemevents.etl file, we can now start our Extended Events Session in SQL Server, and run our test workload.  To ensure that we get physical reads from disk the following example will clear the Buffer Cache before starting the Event Session.

USE [AdventureWorks2008]
GO
-- Clear the Buffer Cache to force reads from Disk
DBCC DROPCLEANBUFFERS
GO

-- Start the Event Session so we capture the Events caused by running the test
ALTER EVENT SESSION etw_test_session
ON SERVER
STATE=START
GO
If you run this on a SQL Server where you use a minimal privilege AD Account for the SQL Server Service Account, you will get an error similar to the following:

Msg 25641, Level 16, State 0, Line 2

For target, "CE79811F-1A80-40E1-8F5D-7445A3F375E7.package0.etw_classic_sync_target", the parameter "default_etw_session_logfile_path" passed is invalid.  The operating system returned error 5 (ACCESS_DENIED) while creating an ETW tracing session.  Ensure that the SQL Server startup account is a member of the ‘Performance Log Users’ group and then retry your command.

If this occurs, the Service Account does not have sufficient privileges to use the ETW provider, and it will be necessary to add the SQL Service Account to the Performance Log Users group on the SQL Server and then restart the SQL Server Database Engine service for the permissions change to take effect.  (Yet another pre/post Installation Checklist item that needs to be performed!)  Once the Event Session is started, we can run a query to generate some Events and cause physical reads to occur from disk.

-- Run the Simple SELECT against AdventureWorks
SELECT SUM(TotalDue), SalesPersonID
FROM Sales.SalesOrderHeader
GROUP BY SalesPersonID
GO
Once the query completes we can stop our Event SessionWith we can stop the NT Kernel Logger using the logman utility again:

logman update "NT Kernel Logger" /fd /ets

logman stop "NT Kernel Logger" /ets

An XEvent a Day (10 of 31)   Targets Week   etw classic sync target   image thumb

With the Kernel Logger stopped, we can then stop our Event Session inside of SQL Server:

---- Start the Event Session so we capture the Events caused by running the test
ALTER EVENT SESSION etw_test_session
ON SERVER
STATE=STOP

However, even though we stopped the Event Session in SQL Server, the XE_DEFAULT_ETW_SESSION still exists in the Windows OS.

logman query -ets

An XEvent a Day (10 of 31)   Targets Week   etw classic sync target   image thumb

Or if you are using Windows Server 2008/2008R2, the Performance Monitor can show you the Event Session:

An XEvent a Day (10 of 31)   Targets Week   etw classic sync target   image thumb

In either case we need to flush the buffers for the XE_DEFAULT_ETW_SESSION and in this case stop it.

logman update XE_DEFAULT_ETW_SESSION /fd /ets

logman stop XE_DEFAULT_ETW_SESSION /ets

An XEvent a Day (10 of 31)   Targets Week   etw classic sync target   image thumb

With the two ETW sessions stopped, we can now use tracerpt to merge the trace files together and output them to a CSV file.

(Note: The following commands are specific to Windows Server 2008/2008R2 if you are using Windows Server 2003, tracerpt does not have a –of option and will output the merged results in CSV format by default.  The default in Windows Server 2008/2008R2 is XML format.)

tracerpt C:\SQLBlog\systemevents.etl C:\SQLBlog\sqletwtarget.etl -o C:\SQLBlog\ETW_Merged.csv -of CSV

An XEvent a Day (10 of 31)   Targets Week   etw classic sync target   image thumb

With the results merged in a CSV there are a number of options available for how to work with the data.  If we just open up the CSV file and look at scroll down through the information we can see that the SQL Server async_io_requested Events that lead to file_read events, the setting of wait_info Event and the subsequent Kernel level DiskIO Read Event.

An XEvent a Day (10 of 31)   Targets Week   etw classic sync target   image thumb

As cool as this seems like it is, if you have done any work with ETW in Windows, you know that the future is even brighter than this simple example begins to touch on.  The Windows Performance Analyzer and xperf offer a way to read ETW trace files and generate a graphical presentation of the information held within them.  For example if we use xperf to view the Kernel Logger file:

An XEvent a Day (10 of 31)   Targets Week   etw classic sync target   image thumb

However, the Kernel Logger uses the newer Manifest based provider in Windows Server 2008 and 2008R2, and since SQL Server 2008 Extended Events uses the classic provider, xperf doesn’t recognize the Event names for the Events contained in the ETW trace file, and instead you get a bunch of Guid’s that require manual deciphering.

An XEvent a Day (10 of 31)   Targets Week   etw classic sync target   image thumb

If you happen to be running SQL Server 2008/2008R2 on Windows Server 2003, which I happen to be in most of my demonstration VM’s that I use for speaking (Windows Server 2003 takes significantly less disk space than 2008 and its at a premium on my laptops 120GB SSD), the sqletwtarget.etl and systemevents.etl files generated by this demo will have the same version and xperf can be used to open both files together and merge their respective Event Views:

An XEvent a Day (10 of 31)   Targets Week   etw classic sync target   image thumb

The ProviderIds window is not expanded here, but it has the same Guids that the first example had.  Keep in mind that the above merged view came from a different system than the original two xperf views, but they used the same exact demo to generate.

Considerations for Usage

I have often commented in presentations that the etw_classic_sync_target Target is not something that the average DBA is going to make meaningful use of in troubleshooting problems with SQL Server.  At PASS this year, I had some eyebrows raised when I mentioned this in my presentation on Extended Events, but I stand by that statement, even after trying to brush up on ETW for this blog post, I’ve ran into numerous complications associated with actually consuming the ETW session information, that required that I perform further research to figure things out.  There is certainly meaningful information available through the use of the etw_classic_sync_target Target with Extended Events, when merged with Kernel level tracing as demonstrated later in this blog post.  However, when focusing on general troubleshooting, the etw_classic_sync_target should not be considered the target of choice.
Using Multiple Targets to Debug Orphaned Transactions
http://www.sqlskills.com/blogs/jonathan/an-xevent-a-day-11-of-31-targets-week-using-multiple-targets-to-debug-orphaned-transactions/
使用多目标调试孤儿事务
killing the session should not be taken lightly:杀进程的时候不能掉以轻心
With no way to tell what exactly would be rolled back:sql不会显示要回滚哪些事务
用ssms伪装为某个程序,只需要在连接字符串里添加applicationname
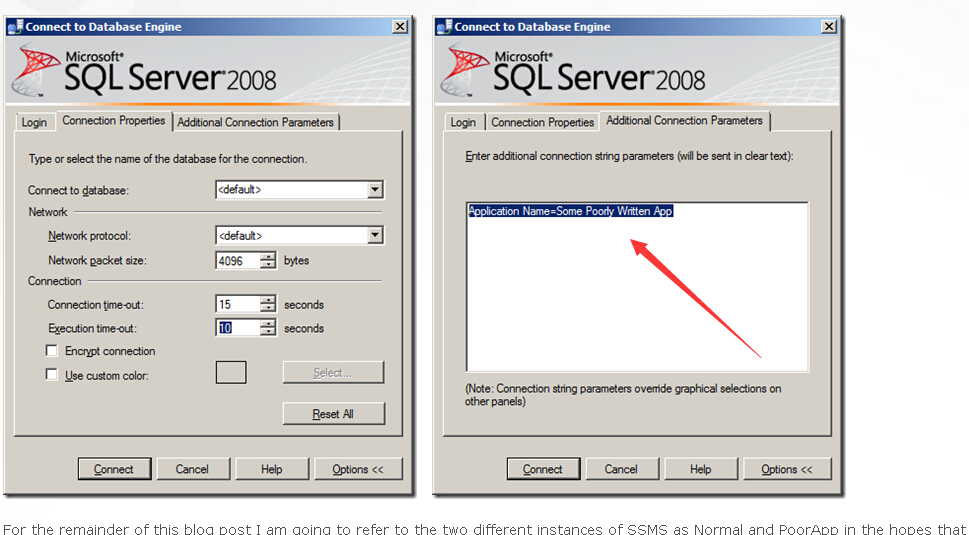
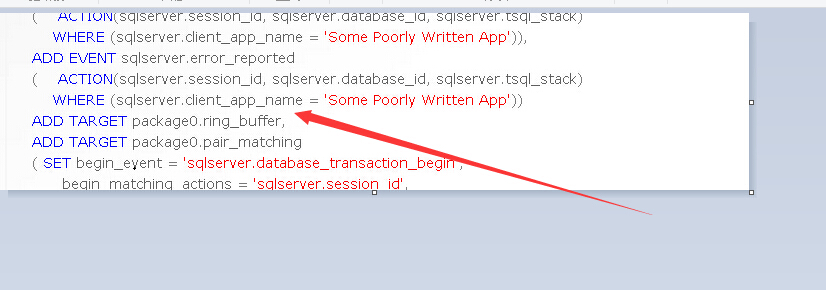
Why Multiple Targets?

You might ask why you would want to use multiple Targets in an Event Session with Extended Events?  The best answer is because each of the Targets handles the Event data in different ways, and by combining their uses, you can easily simplify the task of tracking down problems.  Two days ago I talked about the pair_matching Target and how it only retains Events that have not been matched.  Two years ago out of nowhere, one of the production databases I supported started having transaction log growth problems.  After growing the log for the second time in a day, I started looking at the database because something was obviously not right.

The first place I looked was the sys.databases DMV and specifically the log_reuse_wait_desc column, which provides the reason that the transaction log for a database is not truncating.  When I queried this DMV, I found that the log_reuse_wait_desc was ACTIVE_TRANSACTION, meaning that the database had an open transaction.  So I ran DBCC OPENTRAN to get some more information about the open transaction (you can query the DMV’s for this information as well) and found that the transaction had been open for over 8 hours.  I queried sys.dm_exec_sessions for the session_id and found that the session was still being used and had submitted a request within the last minute, so it seemed to be an orphaned transaction.

SELECT
    session_id,
    login_time,
    last_request_start_time,
    last_request_end_time
FROM sys.dm_exec_sessions
WHERE session_id = 76
After discussions with the Analyst for the application and the applications vendor, it was decided that the session should be killed forcing a ROLLBACK of the transaction and allowing the log to be truncate.  (I’ll discuss why this might prove be problematic later in this post)  This resolved the problem, at least until the next day when the database began running out of space in the transaction log again, and once again had an open transaction that had been open for hours on a session that was sill being used by the application.  What was really interesting was there was no correlation between the previous days open transactions begin time, and the begin time of the second occurrence of the problem, so it seemed to be a completely random occurrence which was not going to be easy to troubleshoot.

I created a server side trace and tried over the next two days to figure out what the issue actually was, but didn’t make much head way until I expanded the trace to have the statement starting and completed events along with the Errors and Warnings Events in the trace.  When the problem reoccurred, I was able to read through the trace files using filtering to minimize the Trace Events captured down to the specific spid that held the open transaction and the events that occurred five minutes before and after the transaction_begin_time for the open transaction.  While looking at the event information I found an Attention Event and was able to deduce what had happened.

The application was a ASP.NET application, and the vendor used the CommandTimeout default which is 30 seconds.  What happened was that a process was invoked that called a stored procedure to archive information from a transactional table into an archive table inside of the database, and the number of rows being archived caused the stored procedures execution to exceeded 30 seconds resulting in a timeout in the ASP.NET application, and the application silently handled the exception by doing nothing.  The problem was that the stored procedure issued a BEGIN TRANSACTION before archiving the rows, and when the timeout occurred and the Attention Event was raised, the command aborted leaving the open transaction and creating the problem with the log not truncating.

The connection was returned to the ASP.NET Connection Pool, and was constantly being reused by the application to do who knows what other operations, which is where killing the connection was potentially a very bad thing to do.  All of the activity performed by this session was performed under the open transaction, so by killing the session, all of the activity would be rolled back.  With no way to tell what exactly would be rolled back, killing the session should not be taken lightly.

For the remainder of this post I am going to show a repro of this particular problem and how to use Multiple Targets in Extended Events to simplify the troubleshooting this.

Setting Up the Demo

To setup a reproduction of this problem you will need two instances of SSMS open.  One of them will be used to connect to the SQL Server normally, and the other will be used to act like the ASP.NET application that originally had the problem.  To setup the second instance of SSMS to act like the ASP.NET application, we are going to set the Execution Timeout using the Options of the Connect to Database Engine window, and we are also going to add an Additional Connection Parameter to the connection to set the Application Name on the connection to “Some Poorly Written App” as shown in the below screenshots from SSMS.

An XEvent a Day (11 of 31) – Targets Week – Using Multiple Targets to Debug Orphaned Transactions   image thumb    An XEvent a Day (11 of 31) – Targets Week – Using Multiple Targets to Debug Orphaned Transactions   image thumb

For the remainder of this blog post I am going to refer to the two different instances of SSMS as Normal and PoorApp in the hopes that this prevents confusion.

In the Normal SSMS we will create a database and some objects to support the repro of the problem:

CREATE DATABASE [MultiTargetDemo]
GO
USE [MultiTargetDemo]
GO
CREATE TABLE dbo.RandomObjectsArchive
(ArchiveID int identity primary key,
 TableName nvarchar(128),
 IndexName nvarchar(128),
 ColumnName nvarchar(128))
GO
CREATE TABLE dbo.TrackArchiveRunTimes
(RuntimeID int identity primary key,
 ArchiveRuntime datetime DEFAULT(CURRENT_TIMESTAMP))
GO
CREATE PROCEDURE dbo.GenerateRandomObjects
AS
BEGIN TRANSACTION
    INSERT INTO dbo.TrackArchiveRunTimes
    DEFAULT VALUES;

    INSERT INTO RandomObjectsArchive
        (TableName, IndexName, ColumnName)
    SELECT TOP 10000 a.name, i.name, c.name
    FROM sys.objects AS a
        CROSS JOIN sys.indexes AS i
        CROSS JOIN sys.columns AS c
        CROSS JOIN master.dbo.spt_values AS sv
    WHERE sv.type = 'P'
      AND sv.number < 6 --Adjust to increase runtime
    ORDER BY NEWID() DESC
COMMIT TRANSACTION
GO
USE [master]
GO
The GenerateRandomObjects stored procedure Inserts a row into a tracking table that tracks when the stored procedure was executed, and then simulates a long running archive process by doing something that you should never do in production code.  The sv.number predicate in the query can be increased or decreased based on the performance of the system being tested against to ensure that the stored procedure runs longer than the Execution Timeout setting, which on my PoorApp SSMS instance was set to 10 seconds.  Increasing the value by 1 has an exponential impact on the performance degradation of the stored procedure, so any changes should be made incrementally to ensure that you don’t create a tempdb bloat problem with the Cartesian product of the query being executed.

Setting Up the Event Session

To troubleshoot this problem using Extended Events we will create an Event Session that captures the following Events:

sqlserver.database_transaction_begin

sqlserver.database_transaction_end

sqlserver.sql_statement_starting

sqlserver.sql_statement_completed

sqlserver.sp_statement_starting

sqlserver.sp_statement_completed

sqlserver.rpc_starting

sqlserver.rpc_completed

sqlserver.module_start

sqlserver.module_end

sqlserver.error_reported

We’ll add the following Actions to each of the Events:

sqlserver.session_id

sqlserver.database_id

sqlserver.tsql_stack

and add the sqlserver.sql_text Action to the starting Events so that we can track what is actually being executed.  Every Event in the Event Session will have a Predicate on the sqlserver.client_app_name so that the Event only fires for connections and requests from “Some Poorly Written App”.

IF EXISTS(SELECT *
         FROM sys.server_event_sessions
         WHERE name='OrphanedTransactionHunter')
    DROP EVENT SESSION [OrphanedTransactionHunter] ON SERVER;
CREATE EVENT SESSION OrphanedTransactionHunter
ON SERVER
ADD EVENT sqlserver.database_transaction_begin
(    ACTION(sqlserver.session_id, sqlserver.database_id, sqlserver.tsql_stack)
    WHERE (sqlserver.client_app_name = 'Some Poorly Written App')),
ADD EVENT sqlserver.database_transaction_end
(    ACTION(sqlserver.session_id, sqlserver.database_id, sqlserver.tsql_stack)
    WHERE (sqlserver.client_app_name = 'Some Poorly Written App')),
ADD EVENT sqlserver.sql_statement_starting
(    ACTION(sqlserver.session_id, sqlserver.database_id, sqlserver.tsql_stack, sqlserver.sql_text)
    WHERE (sqlserver.client_app_name = 'Some Poorly Written App')),
ADD EVENT sqlserver.sql_statement_completed
(    ACTION(sqlserver.session_id, sqlserver.database_id, sqlserver.tsql_stack)
    WHERE (sqlserver.client_app_name = 'Some Poorly Written App')),
ADD EVENT sqlserver.sp_statement_starting
(    ACTION(sqlserver.session_id, sqlserver.database_id, sqlserver.tsql_stack, sqlserver.sql_text)
    WHERE (sqlserver.client_app_name = 'Some Poorly Written App')),
ADD EVENT sqlserver.sp_statement_completed
(    ACTION(sqlserver.session_id, sqlserver.database_id, sqlserver.tsql_stack)
    WHERE (sqlserver.client_app_name = 'Some Poorly Written App')),
ADD EVENT sqlserver.rpc_starting
(    ACTION(sqlserver.session_id, sqlserver.database_id, sqlserver.tsql_stack, sqlserver.sql_text)
    WHERE (sqlserver.client_app_name = 'Some Poorly Written App')),
ADD EVENT sqlserver.rpc_completed
(    ACTION(sqlserver.session_id, sqlserver.database_id, sqlserver.tsql_stack)
    WHERE (sqlserver.client_app_name = 'Some Poorly Written App')),
ADD EVENT sqlserver.module_start
(    ACTION(sqlserver.session_id, sqlserver.database_id, sqlserver.tsql_stack, sqlserver.sql_text)
    WHERE (sqlserver.client_app_name = 'Some Poorly Written App')),
ADD EVENT sqlserver.module_end
(    ACTION(sqlserver.session_id, sqlserver.database_id, sqlserver.tsql_stack)
    WHERE (sqlserver.client_app_name = 'Some Poorly Written App')),
ADD EVENT sqlserver.error_reported
(    ACTION(sqlserver.session_id, sqlserver.database_id, sqlserver.tsql_stack)
    WHERE (sqlserver.client_app_name = 'Some Poorly Written App'))
ADD TARGET package0.ring_buffer,
ADD TARGET package0.pair_matching
( SET begin_event = 'sqlserver.database_transaction_begin',
      begin_matching_actions = 'sqlserver.session_id',
      end_event = 'sqlserver.database_transaction_end',
      end_matching_actions = 'sqlserver.session_id',
      respond_to_memory_pressure = 1
)
WITH (MAX_DISPATCH_LATENCY=5 SECONDS, TRACK_CAUSALITY=ON)
GO

ALTER EVENT SESSION OrphanedTransactionHunter
ON SERVER
STATE=START
GO
Fired Events will be dispatched to two different Targets, the package0.ring_buffer to capture the Raw Data (in a true production environment, the package0.asynchronous_file_target would generally be a better Target for Raw Data capture of any volume), and the package0.pair_matching Target which has been configured to match on the sqlserver.database_transaction_begin/end Events based on the sqlserver.session_id Action.  To ensure that we can track the relationship between events, the Event Session will have TRACK_CAUSALITY set to ON, and to minimize the time it takes for Events to be dispatched for our test, the MAX_DISPATCH_LATENCY will be set to 5 seconds.

Putting It All Together

With the Event Session running, we can change over to our PoorApp SSMS instance and execute the GenerateRandomObjects stored procedure inside of the MultiTargetDemo database.

EXECUTE MultiTargetDemo.dbo.GenerateRandomObjects
When this executes, the command will timeout and leave the transaction open, simulating the original problem exactly.  Once the query times out, switch back to the Normal SSMS Instance and in a new window execute the stored procedure again and allow it complete its execution.  Since the default timeout of 0 is used in the Normal SSMS Instance, the execution will not time out.  Then we can look at the sys.databases DMV and see that the log_reuse_wait_desc is ACTIVE_TRANSACTION.

SELECT log_reuse_wait_desc
FROM sys.databases
WHERE database_id = DB_ID('MultiTargetDemo')
An XEvent a Day (11 of 31) – Targets Week – Using Multiple Targets to Debug Orphaned Transactions   image thumb

If we look at DBCC OPENTRAN for the MultiTargetDemo database we will see our orphaned transaction:

DBCC OPENTRAN([MultiTargetDemo])
An XEvent a Day (11 of 31) – Targets Week – Using Multiple Targets to Debug Orphaned Transactions   image thumb

As I mentioned earlier in this post, the transaction can also be seen in the DMV’s:

SELECT
    dtst.session_id,
    dtdt.database_id,
    dtst.transaction_id,
    dtat.name,
    dtdt.database_transaction_begin_time
FROM sys.dm_tran_session_transactions AS dtst
JOIN sys.dm_tran_active_transactions AS dtat
    ON dtst.transaction_id = dtat.transaction_id
JOIN sys.dm_tran_database_transactions AS dtdt
    ON dtdt.transaction_id = dtst.transaction_id
WHERE database_id = DB_ID('MultiTargetDemo')
An XEvent a Day (11 of 31) – Targets Week – Using Multiple Targets to Debug Orphaned Transactions   image thumb

Now that we have our problem reproduced, lets look at how we can use the information captured by our Extended Event Session to track it back to the source of the problem.  First we’ll query the pair_matching Target to find out information about the sqlserver.database_transaction_begin Event that was unmatched.

-- Query the XML to get the Target Data
SELECT
    n.value('(event/@name)[1]', 'varchar(50)') AS event_name,
    n.value('(event/@package)[1]', 'varchar(50)') AS package_name,
    DATEADD(hh,
            DATEDIFF(hh, GETUTCDATE(), CURRENT_TIMESTAMP),
            n.value('(event/@timestamp)[1]', 'datetime2')) AS [timestamp],
    n.value('(event/action[@name="session_id"]/value)[1]', 'int') as session_id,
    n.value('(event/action[@name="database_id"]/value)[1]', 'int') as [database_id],
    n.value('(event/action[@name="tsql_stack"]/value)[1]', 'nvarchar(max)') as tsql_stack,
    n.value('(event/action[@name="attach_activity_id"]/value)[1]', 'varchar(50)') as attach_activity_id
FROM
(    SELECT td.query('.') as n
    FROM
    (
        SELECT CAST(target_data AS XML) as target_data
        FROM sys.dm_xe_sessions AS s
        JOIN sys.dm_xe_session_targets AS t
            ON t.event_session_address = s.address
        WHERE s.name = 'OrphanedTransactionHunter'
          AND t.target_name = 'pair_matching'
    ) AS sub
    CROSS APPLY target_data.nodes('PairingTarget/event') AS q(td)
) as tab
-- We are interested in unmatched sqlserver.database_transaction_begin Events
WHERE n.value('(event/@name)[1]', 'varchar(50)') = 'database_transaction_begin'
ORDER BY session_id, activity_id
GO
An XEvent a Day (11 of 31) – Targets Week – Using Multiple Targets to Debug Orphaned Transactions   image thumb

From this we can see our orphaned transaction event, and find the attach_activity_id of that Event.  The attach_activity_id Action is added to the Events in an Event Session when TRACK_CAUSALITY is turned ON.  There are two pieces of information contained in the attach_activity_id Action, the activity Guid (the first 36 characters of the value) and the sequence number for the Event, the number following the Guid.  The Guid can be used to find related Events, and the sequence number can be used to determine the order that the Events occurred.  By using the Guid from the attach_activity_id Action from our first query, we can query the ring_buffer Target and parse out the specific Events we are interested in looking at further.

-- Query the XML to get the Target Data
SELECT
    n.value('(event/@name)[1]', 'varchar(50)') AS event_name,
    n.value('(event/@package)[1]', 'varchar(50)') AS package_name,
    DATEADD(hh,
            DATEDIFF(hh, GETUTCDATE(), CURRENT_TIMESTAMP),
            n.value('(event/@timestamp)[1]', 'datetime2')) AS [timestamp],
    n.value('(event/action[@name="database_id"]/value)[1]', 'int') as [database_id],
    n.value('(event/action[@name="session_id"]/value)[1]', 'int') as [session_id],
    n.value('(event/data[@name="object_id"]/value)[1]', 'int') AS [object_id],
    n.value('(event/data[@name="object_type"]/value)[1]', 'nvarchar(128)') AS [object_type],
    n.value('(event/data[@name="object_name"]/value)[1]', 'nvarchar(128)') AS [object_name],
    n.value('(event/data[@name="error"]/value)[1]', 'int') AS [error],
    n.value('(event/data[@name="severity"]/value)[1]', 'int') AS [severity],
    n.value('(event/data[@name="state"]/value)[1]', 'int') AS [state],
    n.value('(event/data[@name="user_defined"]/value)[1]', 'bit') AS [user_defined],
    n.value('(event/data[@name="message"]/value)[1]', 'nvarchar(4000)') AS [message],
    n.value('(event/data[@name="duration"]/value)[1]', 'int') AS [duration],
    n.value('(event/data[@name="row_count"]/value)[1]', 'int') AS [row_count],
    n.value('(event/data[@name="cpu"]/value)[1]', 'int') AS [cpu],
    n.value('(event/data[@name="reads"]/value)[1]', 'int') AS [reads],
    n.value('(event/data[@name="writes"]/value)[1]', 'int') AS [writes],
    n.value('(event/action[@name="tsql_stack"]/value)[1]', 'nvarchar(max)') AS [tsql_stack],
    n.value('(event/data[@name="offset"]/value)[1]', 'int') AS [offset],
    n.value('(event/data[@name="offset_end"]/value)[1]', 'int') AS [offset_end],
    n.value('(event/data[@name="nest_level"]/value)[1]', 'int') AS [nest_level],
     n.value('(event/action[@name="sql_text"]/value)[1]', 'nvarchar(max)') AS [sql_text],
    CAST(SUBSTRING(n.value('(event/action[@name="attach_activity_id"]/value)[1]', 'varchar(50)'), 1, 36) AS uniqueidentifier) AS activity_id,
    CAST(SUBSTRING(n.value('(event/action[@name="attach_activity_id"]/value)[1]', 'varchar(50)'), 38, 10) AS int) AS event_sequence
FROM
(    SELECT td.query('.') as n
    FROM
    (
        SELECT CAST(target_data AS XML) as target_data
        FROM sys.dm_xe_sessions AS s
        JOIN sys.dm_xe_session_targets AS t
            ON t.event_session_address = s.address
        WHERE s.name = 'OrphanedTransactionHunter'
          AND t.target_name = 'ring_buffer'
    ) AS sub
    CROSS APPLY target_data.nodes('RingBufferTarget/event') AS q(td)
) as tab
-- We are interested in unmatched sqlserver.database_transaction_begin Events
WHERE SUBSTRING(n.value('(event/action[@name="attach_activity_id"]/value)[1]', 'varchar(50)'), 1, 36) = 'ADCF379A-4BCA-41BA-9B08-4C2265894392'
ORDER BY session_id, event_sequence
GO


With a little bit more work, we can reduce the XML parsing to only the important data elements that we need, and we can parse the tsql_stack Action to retrieve the related Event level statement_text from the sys.dm_exec_sql_text() DMF, since the sql_text Action did not have the intended information.

-- Query the XML to get the Target Data
SELECT
    event_name,
    timestamp,
    database_id,
    OBJECT_NAME(st.objectid, st.dbid) AS ObjectName,
    SUBSTRING(st.text, (tsql_stack.value('(/frame/@offsetStart)[1]', 'int')/2)+1,
        ((CASE tsql_stack.value('(/frame/@offsetEnd)[1]', 'int')
            WHEN -1 THEN DATALENGTH(st.text)
            ELSE tsql_stack.value('(/frame/@offsetEnd)[1]', 'int')
            END - tsql_stack.value('(/frame/@offsetStart)[1]', 'int'))/2) + 1) AS statement_text,
    duration,
    activity_id,
    event_sequence
FROM
(
SELECT
    n.value('(event/@name)[1]', 'varchar(50)') AS event_name,
    DATEADD(hh,
            DATEDIFF(hh, GETUTCDATE(), CURRENT_TIMESTAMP),
            n.value('(event/@timestamp)[1]', 'datetime2')) AS [timestamp],
    n.value('(event/action[@name="database_id"]/value)[1]', 'int') as [database_id],
    n.value('(event/data[@name="duration"]/value)[1]', 'int') AS [duration],
    CAST(n.value('(event/action[@name="tsql_stack"]/value)[1]', 'nvarchar(max)') AS XML) AS [tsql_stack],
    CAST(SUBSTRING(n.value('(event/action[@name="attach_activity_id"]/value)[1]', 'varchar(50)'), 1, 36) AS uniqueidentifier) AS activity_id,
    CAST(SUBSTRING(n.value('(event/action[@name="attach_activity_id"]/value)[1]', 'varchar(50)'), 38, 10) AS int) AS event_sequence
FROM
(    SELECT td.query('.') as n
    FROM
    (
        SELECT CAST(target_data AS XML) as target_data
        FROM sys.dm_xe_sessions AS s
        JOIN sys.dm_xe_session_targets AS t
            ON t.event_session_address = s.address
        WHERE s.name = 'OrphanedTransactionHunter'
          AND t.target_name = 'ring_buffer'
    ) AS sub
    CROSS APPLY target_data.nodes('RingBufferTarget/event') AS q(td)
) as tab
) as tab2
CROSS APPLY sys.dm_exec_sql_text(tsql_stack.value('xs:hexBinary(substring((/frame/@handle)[1], 3))', 'varbinary(max)')) AS st
-- We are interested in Events in activity_id sequence of the orphaned transaction only
WHERE activity_id = 'ADCF379A-4BCA-41BA-9B08-4C2265894392'
ORDER BY session_id, event_sequence
GO
An XEvent a Day (11 of 31) – Targets Week – Using Multiple Targets to Debug Orphaned Transactions   image thumb

The highlighted value shows that the stored procedure execution ended at the Execution Timeout limit that was set for the PoorApp SSMS Instance.  Beyond that we can track each of the statements and see that when the execution ended, it was in the INSERT INTO RandomObjectsArchive statement in the stored procedure allowing us to target our efforts at troubleshooting to the specific problem in a short amount of time.
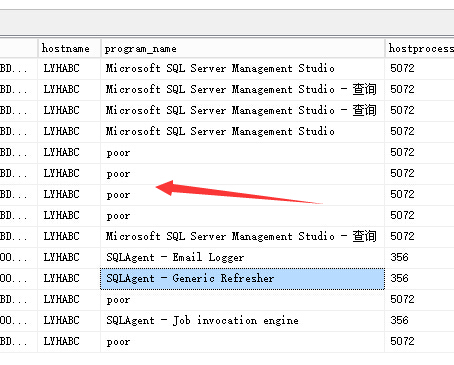
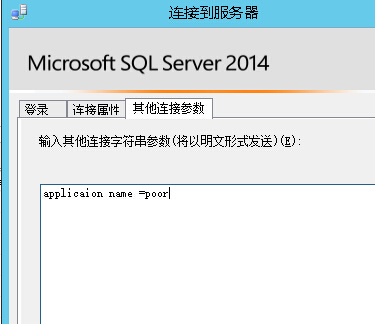
application name=poor
使用异步文件作为数据捕获的目标是最好的
测试中使用 package0.ring_buffer捕获原始数据(在真正的生产环境中,package0.asynchronous_file_target通常会是一个更好的目标原始数据捕获目标
Using the Extended Events SSMS Addin
Using the Extended Events SSMS Addin
--http://www.sqlskills.com/blogs/jonathan/an-xevent-a-day-12-of-31-using-the-extended-events-ssms-addin/
使用扩展事件SSMS插件
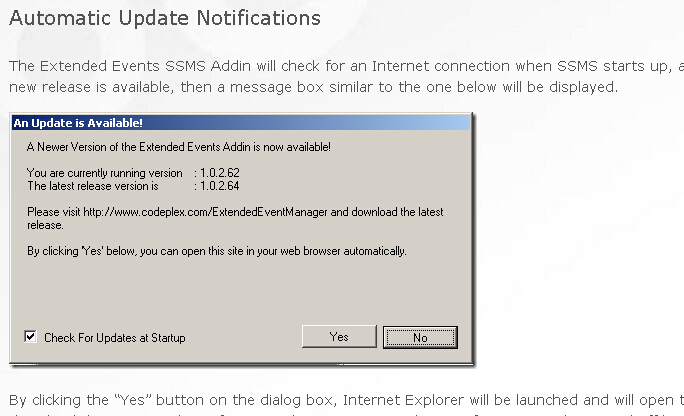
系统默认安装好的 system_health Session
C:\Program Files\Microsoft SQL Server\MSSQL10_50.SQL08R2\MSSQL\Install路径下的
实际上可以在C:\Program Files\Microsoft SQL Server\MSSQL10_50.SQL08R2\MSSQL\Install 路径下找到安装脚本
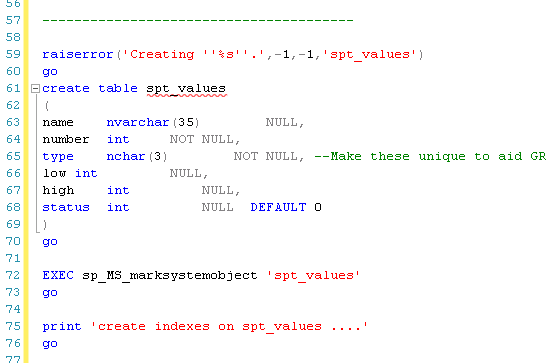
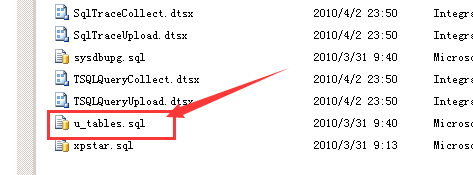
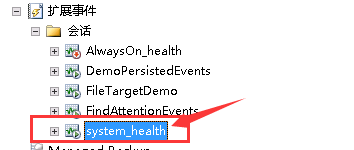


/*
** U_Tables.CQL    --- 1996/09/16 12:22
** Copyright Microsoft, Inc. 1994 - 2000
** All Rights Reserved.
*/

go
use master
go
set nocount on
go


declare @vdt varchar(99)
select  @vdt = convert(varchar,getdate(),113)
raiserror('Starting u_Tables.SQL at  %s',0,1,@vdt) with nowait
raiserror('This file creates all the ''SPT_'' tables.',0,1)
go

if object_id('spt_monitor','U') IS NOT NULL
    begin
    print 'drop table spt_monitor ....'
    drop table spt_monitor
    end

if object_id('spt_values','U') IS NOT NULL
    begin
    print 'drop table spt_values ....'
    drop table spt_values
    end

------------------------------------------------------------------
------------------------------------------------------------------

raiserror('Creating ''%s''.', -1,-1,'spt_monitor')
go

create table spt_monitor
(
    lastrun        datetime    NOT NULL,
    cpu_busy    int        NOT NULL,
    io_busy        int        NOT NULL,
    idle        int        NOT NULL,
    pack_received    int        NOT NULL,
    pack_sent    int        NOT NULL,
    connections    int        NOT NULL,
    pack_errors    int        NOT NULL,
    total_read    int        NOT NULL,
    total_write     int        NOT NULL,
    total_errors     int        NOT NULL
)
go

EXEC sp_MS_marksystemobject 'spt_monitor'
go

---------------------------------------

raiserror('Creating ''%s''.',-1,-1,'spt_values')
go
create table spt_values
(
name    nvarchar(35)        NULL,
number    int        NOT NULL,
type    nchar(3)        NOT NULL, --Make these unique to aid GREP (e.g. SOP, not SET or S).
low    int            NULL,
high    int            NULL,
status    int            NULL  DEFAULT 0
)
go

EXEC sp_MS_marksystemobject 'spt_values'
go

print 'create indexes on spt_values ....'
go

-- 'J','S','P' (maybe 'Z' too?)  challenge uniqueness.
create Unique Clustered index spt_valuesclust on spt_values(type ,number ,name)
go

create Nonclustered index ix2_spt_values_nu_nc on spt_values(number, type)
go


------------------------------------------------------------------
------------------------------------------------------------------

raiserror('Grant Select on spt_ ....',0,1)
go

grant select on spt_values  to public
grant select on spt_monitor to public

go


------------------------------------------------------------------
------------------------------------------------------------------


raiserror('Insert into spt_monitor ....',0,1)
go

insert into spt_monitor
    select
    lastrun = getdate(),
    cpu_busy = @@cpu_busy,
    io_busy = @@io_busy,
    idle = @@idle,
    pack_received = @@pack_received,
    pack_sent = @@pack_sent,
    connections = @@connections,
    pack_errors = @@packet_errors,
    total_read = @@total_read,
    total_write = @@total_write,
    total_errors = @@total_errors
go


-- Caution, 'Z  ' is used by sp_helpsort, though no 'Z  ' rows are inserted by this file.

print 'Insert into spt_values ....'
go

raiserror('Insert spt_values.type=''A  '' ....',0,1)
go
insert into spt_values (name, number, type)
    values ('rpc', 1, 'A')
insert into spt_values (name, number, type)
    values ('pub', 2, 'A')
insert into spt_values (name, number, type)
    values ('sub', 4, 'A')
insert into spt_values (name, number, type)
    values ('dist', 8, 'A')
insert into spt_values (name, number, type)
    values ('dpub', 16, 'A')
insert into spt_values (name, number, type)
    values ('rpc out', 64, 'A')
insert into spt_values (name, number, type)
    values ('data access', 128, 'A')
insert into spt_values (name, number, type)
    values ('collation compatible', 256, 'A')
insert into spt_values (name, number, type)
    values ('system', 512, 'A')
insert into spt_values (name, number, type)
    values ('use remote collation', 1024, 'A')
insert into spt_values (name, number, type)
    values ('lazy schema validation', 2048, 'A')
insert into spt_values (name, number, type)
    values ('remote proc transaction promotion', 4096, 'A')
-- NOTE: PLEASE UPDATE ntdbms\include\systabre.h WHEN USING
--  ADDITIONAL SYSSERVER STATUS BITS! (enum ESrvStatusBits)
go


raiserror('Insert spt_values.type=''B  '' ....',0,1)
go
insert spt_values (name, number, type)
    values ('YES OR NO', -1, 'B')
insert spt_values (name, number, type)
    values ('no', 0, 'B')
insert spt_values (name, number, type)
    values ('yes', 1, 'B')
insert spt_values (name, number, type)
    values ('none', 2, 'B')
go

-- types 'D'(sysdatabase.status) and 'DC'(sysdatabase.category)
-- and 'D2'(sysdatabases.status2) are options settable by sp_dboption

raiserror('Insert spt_values.type=''D  '' ....',0,1)
go
---- If you add a bit here make sure you add the value to the value of the ALL SETTABLE DB status option if it is settable with sp_dboption.

insert spt_values (name, number, type)
    values ('DATABASE STATUS', 0, 'D')
--These bits come from sysdatabases.status.
insert spt_values (name, number, type)
    values ('autoclose', 1, 'D')
insert spt_values (name, number, type)
    values ('select into/bulkcopy', 4, 'D')
insert spt_values (name, number, type)
    values ('trunc. log on chkpt.', 8, 'D')
insert spt_values (name, number, type)
    values ('torn page detection', 16, 'D')
insert spt_values (name, number, type)
    values ('loading', 32, 'D')  -- Had been "don't recover".
insert spt_values (name, number, type)
    values ('pre recovery', 64, 'D') -- not settable
insert spt_values (name, number, type)
    values ('recovering', 128, 'D') -- not settable
insert spt_values (name, number, type)
    values ('not recovered', 256, 'D')  -- suspect - not settable
insert into spt_values(name, number, type, low, high)
    values ('offline', 512, 'D', 0, 1)
insert spt_values (name, number, type)
    values ('read only', 1024, 'D')
insert spt_values (name, number, type)
    values ('dbo use only', 2048, 'D')
insert spt_values (name, number, type)
    values ('single user', 4096, 'D')
insert spt_values (name, number, type)
    values ('emergency mode', 32768, 'D') -- not settable
insert spt_values (name, number, type)
    values ('autoshrink',  4194304, 'D')
insert spt_values (name, number, type) -- not settable
    values ('missing files',  0x40000, 'D')
insert spt_values (name, number, type) -- not settable
    values ('cleanly shutdown',  0x40000000, 'D')
insert spt_values (name, number, type)
    values ('ALL SETTABLE OPTIONS', 4202013, 'D')
go


insert spt_values (name, number, type)
    values ('DATABASE OPTIONS', 0, 'D2')
--These bits come from sysdatabases.status2.
insert spt_values (name, number, type)
    values ('db chaining', 0x400, 'D2')
insert spt_values (name, number, type)
    values ('numeric roundabort', 0x800, 'D2')
insert spt_values (name, number, type)
    values ('arithabort', 0x1000, 'D2')
insert spt_values (name, number, type)
    values ('ANSI padding', 0x2000, 'D2')
insert spt_values (name, number, type)
    values ('ANSI null default', 0x4000, 'D2')
insert spt_values (name, number, type)
    values ('concat null yields null', 0x10000, 'D2')
insert spt_values (name, number, type)
    values ('recursive triggers', 0x20000, 'D2')
insert spt_values (name, number, type)
    values ('default to local cursor',  0x100000, 'D2')
insert spt_values (name, number, type)
    values ('quoted identifier', 0x800000, 'D2')
insert spt_values (name, number, type)
    values ('auto create statistics', 0x1000000, 'D2')
insert spt_values (name, number, type)
    values ('cursor close on commit', 0x2000000, 'D2')
insert spt_values (name, number, type)
    values ('ANSI nulls', 0x4000000, 'D2')
insert spt_values (name, number, type)
    values ('ANSI warnings', 0x10000000, 'D2')
insert spt_values (name, number, type) -- not user settable
    values ('full text enabled', 0x20000000, 'D2')
insert spt_values (name, number, type)
    values ('auto update statistics', 0x40000000, 'D2')


-- Sum of bits of all settable DB status options,
-- update when adding such options or modifying existing options to be settable.
insert spt_values (name, number, type)
    values ('ALL SETTABLE OPTIONS', 1469267968|0x800|0x1000|0x2000|0x400, 'D2')
go

raiserror('Insert spt_values.type=''DC '' ....',0,1)
go
---- If you add a bit here make sure you add the value to the value of the ALL SETTABLE DB category option if it is settable with sp_dboption.

insert spt_values (name, number, type)
    values ('DATABASE CATEGORY', 0, 'DC')

--These bits come from sysdatabases.category.
insert spt_values (name, number, type)
    values ('published', 1, 'DC')
insert spt_values (name, number, type)
    values ('subscribed', 2, 'DC')
insert spt_values (name, number, type)
    values ('merge publish', 4, 'DC')

--These are not settable by sp_dboption
insert spt_values (name, number, type)
    values ('Distributed', 16, 'DC')

--Sum of bits of all settable options, update when adding such options or modifying existing options to be settable.
insert spt_values (name, number, type)
    values ('ALL SETTABLE OPTIONS', 7, 'DC')
go

--UNDONE: Are these obsolete?
--raiserror('Insert spt_values.type=''DBV'' ....',0,1)
--go
--insert into spt_values (name ,number ,type,low,high)
--    values ('SYSDATABASES.VERSION', 0, 'DBV',-1,-1) --- dbcc getvalue('current_version') into @@error
--insert into spt_values (name ,number ,type,low,high)
--    values ('4.2' ,199307 ,'DBV',1,1)  --WinNT version
--insert into spt_values (name ,number ,type,low,high)
--    values ('6.0' ,199506 ,'DBV',400,406) --Betas thru Release range was 400-406.
--insert into spt_values (name ,number ,type,low,high)
--    values ('6.5' ,199604 ,'DBV',407,408) --First beta already had 408.

--declare @dbver int
--dbcc getvalue('current_version')
--select @dbver = @@error
--insert into spt_values (name ,number ,type,low,high)
--    values ('7.0' ,199707 ,'DBV',409 ,@dbver)
--go


raiserror('Insert spt_values.type=''E  '' ....',0,1)
go
--Set the machine type
--spt_values.low is the number of bytes in a page for the particular machine.
insert spt_values (name, number, type, low)
    values ('SQLSERVER HOST TYPE', 0, 'E', 0)
go
--Set the platform specific entries.
--spt_values.low is the number of bytes in a page.
insert into spt_values (name, number, type, low)
    values ('WINDOWS/NT', 1, 'E', 8192)

/* Value to set and clear the high bit for int datatypes for os/2.
** Would like to enter -2,147,483,648 to avoid byte order issues, but
** the server won't take it, even in exponential notation.
*/
insert into spt_values (name, number, type, low)
    values ('int high bit', 2, 'E', 0x80000000)

/* Value which gives the byte position of the high byte for int datatypes for
** os/2.  This value was changed from 4 (the usual Intel 80x86 order) to 1
** when binary convert routines were changed to reverse the byte order.  So
** this value is accurate ONLY when ints are converted to binary datatype.
*/
insert into spt_values (name, number, type, low)
    values ('int4 high byte', 3, 'E', 1)
go


raiserror('Insert spt_values.type=''F  '' ....',0,1)
go
insert spt_values (name, number, type)
    values ('SYSREMOTELOGINS TYPES', -1, 'F')
insert spt_values (name, number, type)
    values ('', 0, 'F')
insert spt_values (name, number, type)
    values ('trusted', 1, 'F')
go
insert spt_values (name, number, type)
    values ('SYSREMOTELOGINS TYPES (UPDATE)', -1, 'F_U')
insert spt_values (name, number, type)
    values ('', 0, 'F_U')
insert spt_values (name, number, type)
    values ('trusted', 16, 'F_U')
go


raiserror('Insert spt_values.type=''G  '' ....',0,1)
go
insert spt_values (name, number, type)
    values ('GENERAL MISC. STRINGS', 0, 'G')
insert spt_values (name, number, type)
    values ('SQL Server Internal Table', 0, 'G')
go


raiserror('Insert spt_values.type=''I  '' ....',0,1)
go
insert spt_values (name, number, type)
    values ('INDEX TYPES', 0, 'I')
insert spt_values (name, number, type)
    values ('nonclustered', 0, 'I')
insert spt_values (name, number, type)
    values ('ignore duplicate keys', 1, 'I')
insert spt_values (name, number, type)
    values ('unique', 2, 'I')
insert spt_values (name, number, type)
    values ('ignore duplicate rows', 4, 'I')
insert spt_values (name, number, type)
    values ('clustered', 16, 'I')
insert spt_values (name, number, type)
    values ('hypothetical', 32, 'I')
insert spt_values (name, number, type)
    values ('statistics', 64, 'I')
insert spt_values (name, number, type)
    values ('auto create', 8388608, 'I')
insert spt_values (name, number, type)
        values ('stats no recompute', 16777216, 'I')

--ref integ
insert into spt_values (name, number, type, low, high)
    values ('primary key', 2048, 'I', 0, 1)
insert into spt_values (name, number, type, low, high)
    values ('unique key', 4096, 'I', 0, 1)
go


--Adding listing of physical types that are compatible.
raiserror('Insert spt_values.type=''J  '' ....',0,1)
go
insert spt_values (name, number, type)
    values ('COMPATIBLE TYPES', 0, 'J')
insert spt_values (name, number, low, type)
    values ('binary', 1, 45, 'J')
insert spt_values (name, number, low, type)
    values ('varbinary', 1, 37, 'J')
insert spt_values (name, number, low, type)
    values ('bit', 2, 50, 'J')
insert spt_values (name, number, low, type)
    values ('char', 3, 47, 'J')
insert spt_values (name, number, low, type)
    values ('varchar', 3, 39, 'J')
insert spt_values (name, number, low, type)
    values ('datetime', 4, 61, 'J')
insert spt_values (name, number, low, type)
    values ('datetimn', 4, 111, 'J')
insert spt_values (name, number, low, type)
    values ('smalldatetime', 4, 58, 'J')
insert spt_values (name, number, low, type)
    values ('float', 5, 62, 'J')
insert spt_values (name, number, low, type)
    values ('floatn', 5, 109, 'J')
insert spt_values (name, number, low, type)
    values ('real', 5, 59, 'J')
insert spt_values (name, number, low, type)
    values ('int', 6, 56, 'J')
insert spt_values (name, number, low, type)
    values ('intn', 6, 38, 'J')
insert spt_values (name, number, low, type)
    values ('smallint', 6, 52, 'J')
insert spt_values (name, number, low, type)
    values ('tinyint', 6, 48, 'J')
insert spt_values (name, number, low, type)
    values ('money', 7, 60, 'J')
insert spt_values (name, number, low, type)
    values ('moneyn', 7, 110, 'J')
insert spt_values (name, number, low, type)
    values ('smallmoney', 7, 122, 'J')
go


--?!?! obsolete, old syskeys table.
raiserror('Insert spt_values.type=''K  '' ....',0,1)
go
insert spt_values (name, number, type)
    values ('SYSKEYS TYPES', 0, 'K')
insert spt_values (name, number, type)
    values ('primary', 1, 'K')
insert spt_values (name, number, type)
    values ('foreign', 2, 'K')
insert spt_values (name, number, type)
    values ('common', 3, 'K')
go


raiserror('Insert spt_values.type=''L  '' ....',0,1)
-- See also 'SFL' type.
go
insert spt_values(name, number, type)
  values ('LOCK TYPES', 0, 'L')
insert spt_values(name, number, type)
  values ('NULL', 1, 'L')
insert spt_values(name, number, type)
  values ('Sch-S', 2, 'L')
insert spt_values(name, number, type)
  values ('Sch-M', 3, 'L')
insert spt_values(name, number, type)
  values ('S', 4, 'L')
insert spt_values(name, number, type)
  values ('U', 5, 'L')
insert spt_values(name, number, type)
  values ('X', 6, 'L')
insert spt_values(name, number, type)
  values ('IS', 7, 'L')
insert spt_values(name, number, type)
  values ('IU', 8, 'L')
insert spt_values(name, number, type)
  values ('IX', 9, 'L')
insert spt_values(name, number, type)
  values ('SIU', 10, 'L')
insert spt_values(name, number, type)
  values ('SIX', 11, 'L')
insert spt_values(name, number, type)
  values ('UIX', 12, 'L')
insert spt_values(name, number, type)
  values ('BU', 13, 'L')
insert spt_values(name, number, type)
  values ('RangeS-S', 14, 'L')
insert spt_values(name, number, type)
  values ('RangeS-U', 15, 'L')
insert spt_values(name, number, type)
  values ('RangeIn-Null', 16, 'L')
insert spt_values(name, number, type)
  values ('RangeIn-S', 17, 'L')
insert spt_values(name, number, type)
  values ('RangeIn-U', 18, 'L')
insert spt_values(name, number, type)
  values ('RangeIn-X', 19, 'L')
insert spt_values(name, number, type)
  values ('RangeX-S', 20, 'L')
insert spt_values(name, number, type)
  values ('RangeX-U', 21, 'L')
insert spt_values(name, number, type)
  values ('RangeX-X', 22, 'L')
go

-- Lock Resources.
--
raiserror('Insert spt_values.type=''LR '' ....',0,1)
go
insert spt_values(name, number, type)
  values ('LOCK RESOURCES', 0, 'LR')
insert spt_values(name, number, type)
  values ('NUL', 1, 'LR')
insert spt_values(name, number, type)
  values ('DB', 2, 'LR')
insert spt_values(name, number, type)
  values ('FIL', 3, 'LR')
insert spt_values(name, number, type)
  values ('TAB', 5, 'LR')
insert spt_values(name, number, type)
  values ('PAG', 6, 'LR')
insert spt_values(name, number, type)
  values ('KEY', 7, 'LR')
insert spt_values(name, number, type)
  values ('EXT', 8, 'LR')
insert spt_values(name, number, type)
  values ('RID', 9, 'LR')
insert spt_values(name, number, type)
  values ('APP', 10, 'LR')
insert spt_values(name, number, type)
  values ('MD', 11, 'LR')
insert spt_values(name, number, type)
  values ('HBT', 12, 'LR')
insert spt_values(name, number, type)
  values ('AU', 13, 'LR')
go

-- Lock Request Status Values
--
raiserror('Insert spt_values.type=''LS '' ....',0,1)
go
insert spt_values(name, number, type)
  values ('LOCK REQ STATUS', 0, 'LS')
insert spt_values(name, number, type)
  values ('GRANT', 1, 'LS')
insert spt_values(name, number, type)
  values ('CNVT', 2, 'LS')
insert spt_values(name, number, type)
  values ('WAIT', 3, 'LS')
insert spt_values(name, number, type)
  values ('RELN', 4, 'LS')
insert spt_values(name, number, type)
  values ('BLCKN', 5, 'LS')
go

-- Lock Owner Values
--
raiserror('Insert spt_values.type=''LO '' ....',0,1)
go
insert spt_values(name, number, type)
  values ('LOCK OWNER', 0, 'LO')
insert spt_values(name, number, type)
  values ('Xact', 1, 'LO')
insert spt_values(name, number, type)
  values ('Crsr', 2, 'LO')
insert spt_values(name, number, type)
  values ('Sess', 3, 'LO')
insert spt_values(name, number, type)
  values ('STWS', 4, 'LO')
insert spt_values(name, number, type)
  values ('XTWS', 5, 'LO')
insert spt_values(name, number, type)
  values ('WFR', 6, 'LO')
go

-- --- 'O' in 6.5, but gone in Sphinx (sysobjects.sysstat) OBSOLETE ?!?!
raiserror('Insert spt_values.type=''O  '' ....',0,1)
go
/*
**  These values define the object type.  The number made from the low
**  4 bits in sysobjects.sysstats indicates the type of object.
*/
insert spt_values (name, number, type)
    values ('OBJECT TYPES', 0, 'O')
insert spt_values (name, number, type)
    values ('system table', 1, 'O')
insert spt_values (name, number, type)
    values ('view', 2, 'O')
insert spt_values (name, number, type)
    values ('user table', 3, 'O')
insert spt_values (name, number, type)
    values ('stored procedure',4, 'O')
--no number 5
insert spt_values (name, number, type)
    values ('default', 6, 'O')
insert spt_values (name, number, type)
    values ('rule', 7, 'O')
insert spt_values (name, number, type)
    values ('trigger', 8, 'O')
insert spt_values (name, number, type)
    values ('replication filter stored procedure', 12, 'O')
go


-- --- 'O9T' sysobjects.type, for reports like sp_help (violate 1NF in name column).
--     These rows new in 7.0 (old 'O' for sysstat are gone).
--     Use  substring(v.name,1,2)  and  substring(v.name,5,31)
raiserror('Insert spt_values.type=''O9T'' ....',0,1)
go
insert into spt_values (name ,number ,type ,low ,high ,status)
    values ('sysobjects.type, reports'            ,0  ,'O9T' ,0 ,0 ,0)
                 ----+----1----+----2----+----3----+
insert into spt_values (name ,number ,type ,low ,high ,status)
    values ('AF: aggregate function'              ,-1 ,'O9T' ,0 ,0 ,0)
insert into spt_values (name ,number ,type ,low ,high ,status)
    values ('AP: application'                     ,-1 ,'O9T' ,0 ,0 ,0)
insert into spt_values (name ,number ,type ,low ,high ,status)
    values ('C : check cns'                       ,-1 ,'O9T' ,0 ,0 ,0)
insert into spt_values (name ,number ,type ,low ,high ,status)
    values ('D : default (maybe cns)'             ,-1 ,'O9T' ,0 ,0 ,0)
insert into spt_values (name ,number ,type ,low ,high ,status)
    values ('EN: event notification'              ,-1 ,'O9T' ,0 ,0 ,0)
insert into spt_values (name ,number ,type ,low ,high ,status)
    values ('F : foreign key cns'                 ,-1 ,'O9T' ,0 ,0 ,0)
insert into spt_values (name ,number ,type ,low ,high ,status)
    values ('FN: scalar function'                 ,-1 ,'O9T' ,0 ,0 ,0)
insert into spt_values (name ,number ,type ,low ,high ,status)
    values ('FS: assembly scalar function'        ,-1 ,'O9T' ,0 ,0 ,0)
insert into spt_values (name ,number ,type ,low ,high ,status)
    values ('FT: assembly table function'         ,-1 ,'O9T' ,0 ,0 ,0)
insert into spt_values (name ,number ,type ,low ,high ,status)
    values ('IF: inline function'                 ,-1 ,'O9T' ,0 ,0 ,0)
insert into spt_values (name ,number ,type ,low ,high ,status)
    values ('IS: inline scalar function'          ,-1 ,'O9T' ,0 ,0 ,0)
insert into spt_values (name ,number ,type ,low ,high ,status)
    values ('IT: internal table'                  ,-1 ,'O9T' ,0 ,0 ,0)
insert into spt_values (name ,number ,type ,low ,high ,status)
    values ('L : log'                             ,-1 ,'O9T' ,0 ,0 ,0)
insert into spt_values (name ,number ,type ,low ,high ,status)
    values ('P : stored procedure'                ,-1 ,'O9T' ,0 ,0 ,0)
insert into spt_values (name ,number ,type ,low ,high ,status)
    values ('PC : assembly stored procedure'      ,-1 ,'O9T' ,0 ,0 ,0)
insert into spt_values (name ,number ,type ,low ,high ,status)
    values ('PK: primary key cns'                 ,-1 ,'O9T' ,0 ,0 ,0)
insert into spt_values (name ,number ,type ,low ,high ,status)
    values ('R : rule'                            ,-1 ,'O9T' ,0 ,0 ,0)
insert into spt_values (name ,number ,type ,low ,high ,status)
    values ('RF: replication filter proc'         ,-1 ,'O9T' ,0 ,0 ,0)
insert into spt_values (name ,number ,type ,low ,high ,status)
    values ('S : system table'                    ,-1 ,'O9T' ,0 ,0 ,0)
insert into spt_values (name ,number ,type ,low ,high ,status)
    values ('SN: synonym'                         ,-1 ,'O9T' ,0 ,0 ,0)
insert into spt_values (name ,number ,type ,low ,high ,status)
    values ('SQ: queue'                           ,-1 ,'O9T' ,0 ,0 ,0)
insert into spt_values (name ,number ,type ,low ,high ,status)
    values ('TA: assembly trigger'                ,-1 ,'O9T' ,0 ,0 ,0)
insert into spt_values (name ,number ,type ,low ,high ,status)
    values ('TF: table function'                  ,-1 ,'O9T' ,0 ,0 ,0)
insert into spt_values (name ,number ,type ,low ,high ,status)
    values ('TR: trigger'                         ,-1 ,'O9T' ,0 ,0 ,0)
insert into spt_values (name ,number ,type ,low ,high ,status)
    values ('U : user table'                      ,-1 ,'O9T' ,0 ,0 ,0)
insert into spt_values (name ,number ,type ,low ,high ,status)
    values ('UQ: unique key cns'                  ,-1 ,'O9T' ,0 ,0 ,0)
insert into spt_values (name ,number ,type ,low ,high ,status)
    values ('V : view'                            ,-1 ,'O9T' ,0 ,0 ,0)
insert into spt_values (name ,number ,type ,low ,high ,status)
    values ('X : extended stored proc'            ,-1 ,'O9T' ,0 ,0 ,0)
go


--Adding bit position information  ''P''  (helpful with sysprotects.columns).
raiserror('Insert spt_values.type=''P  '' ....',0,1)
go
---- Cannot insert a header/dummy description row for type='P  ' (Bit Position rows).

insert spt_values (name ,number ,type ,low ,high ,status) values (null ,0 ,'P  ' ,1 ,0x00000001 ,0)
insert spt_values (name ,number ,type ,low ,high ,status) values (null ,1 ,'P  ' ,1 ,0x00000002 ,0)
insert spt_values (name ,number ,type ,low ,high ,status) values (null ,2 ,'P  ' ,1 ,0x00000004 ,0)
insert spt_values (name ,number ,type ,low ,high ,status) values (null ,3 ,'P  ' ,1 ,0x00000008 ,0)

insert spt_values (name ,number ,type ,low ,high ,status) values (null ,4 ,'P  ' ,1 ,0x00000010 ,0)
insert spt_values (name ,number ,type ,low ,high ,status) values (null ,5 ,'P  ' ,1 ,0x00000020 ,0)
insert spt_values (name ,number ,type ,low ,high ,status) values (null ,6 ,'P  ' ,1 ,0x00000040 ,0)
insert spt_values (name ,number ,type ,low ,high ,status) values (null ,7 ,'P  ' ,1 ,0x00000080 ,0)

go

-- 'P  ' continued....
declare
     @number_track        integer
    ,@char_number_track    varchar(12)

select     @number_track        = 7
select     @char_number_track    = convert(varchar,@number_track)

-- max columns is 1024 so we need 1024 bit position rows;
-- we'll actually insert entries for more than that
while @number_track < 1024
    begin

    raiserror('type=''P  '' ,@number_track=%d' ,0,1 ,@number_track)

    EXECUTE(
    '
    insert spt_values (name ,number ,type ,low ,high ,status)
      select
         null

        ,(select     max(c_val.number)
            from     spt_values    c_val
            where     c_val.type = ''P  ''
            and     c_val.number between 0 and ' + @char_number_track + '
         )
            + a_val.number + 1

        ,''P  ''

        ,(select     max(b_val.low)
            from     spt_values    b_val
            where     b_val.type = ''P  ''
            and     b_val.number between 0 and ' + @char_number_track + '
         )
            + 1 + (a_val.number / 8)

        ,a_val.high
        ,0
        from
         spt_values    a_val
        where
         a_val.type = ''P  ''
        and     a_val.number between 0 and ' + @char_number_track + '
    ')


    select @number_track = ((@number_track + 1) * 2) - 1
    select @char_number_track = convert(varchar,@number_track)

    end --loop
go


--sysobjects.userstat in 6.5 and backward.  Obsolete ?!?!
raiserror('Insert spt_values.type=''R  '' ....',0,1)
go
/*
**  These values translate the object type's userstat bits.  If the high
**  bit is set for a sproc, then it's a report.
*/
insert spt_values (name, number, type)
    values ('REPORT TYPES', 0, 'R')
insert spt_values (name, number, type)
    values ('', 0, 'R')
insert spt_values (name, number, type)
    values (' (rpt)', -32768, 'R')
go


raiserror('Insert spt_values.type=''SFL'' ....',0,1)
---------------------------------------
-- StarFighter Lock Description Strings
---------------------------------------
go
insert spt_values(name, number, type)
  values ('SF LOCK TYPES', 0, 'SFL')
insert spt_values(name, number, type)
  values ('Extent Lock - Exclusive', 8, 'SFL')
insert spt_values(name, number, type)
  values ('Extent Lock - Update', 9, 'SFL')
insert spt_values(name, number, type)
  values ('Extent Lock - Next', 11, 'SFL')
insert spt_values(name, number, type)
  values ('Extent Lock - Previous', 12, 'SFL')
go


--type=''SOP'' rows for SET Options status info.   See sp_help_setopts, @@options, and config=1534 (''user options'').
raiserror('Insert spt_values.type=''SOP'' ....',0,1)
go
--status&1=1 means configurable via 'user options'.
insert into spt_values (name ,number ,type ,status) values
      ('@@OPTIONS' ,0 ,'SOP' ,0)

insert into spt_values (name ,number ,type ,status) values
      ('disable_def_cnst_check'  ,1 ,'SOP' ,1)

insert into spt_values (name ,number ,type ,status) values
      ('implicit_transactions'   ,2 ,'SOP' ,1)

insert into spt_values (name ,number ,type ,status) values
      ('cursor_close_on_commit'  ,4 ,'SOP' ,1)

insert into spt_values (name ,number ,type ,status) values
      ('ansi_warnings'           ,8 ,'SOP' ,1)

insert into spt_values (name ,number ,type ,status) values
      ('ansi_padding'            ,16 ,'SOP' ,1)

insert into spt_values (name ,number ,type ,status) values
      ('ansi_nulls'              ,32 ,'SOP' ,1)

insert into spt_values (name ,number ,type ,status) values
      ('arithabort'              ,64 ,'SOP' ,1)

insert into spt_values (name ,number ,type ,status) values
      ('arithignore'             ,128 ,'SOP' ,1)

insert into spt_values (name ,number ,type ,status) values
      ('quoted_identifier'       ,256 ,'SOP' ,1)

insert into spt_values (name ,number ,type ,status) values
      ('nocount'                 ,512 ,'SOP' ,1)

--Mutually exclusive when ON.
insert into spt_values (name ,number ,type ,status) values
      ('ansi_null_dflt_on'       ,1024 ,'SOP' ,1)
insert into spt_values (name ,number ,type ,status) values
      ('ansi_null_dflt_off'      ,2048 ,'SOP' ,1)

insert into spt_values (name ,number ,type ,status) values
      ('concat_null_yields_null' ,0x1000 ,'SOP' ,1)

insert into spt_values (name ,number ,type ,status) values
      ('numeric_roundabort'      ,0x2000 ,'SOP' ,1)

insert into spt_values (name ,number ,type ,status) values
      ('xact_abort'                 ,0x4000 ,'SOP' ,1)
go


--Adding sysprotects.action AND protecttype values: thus 'T  ' overloaded but just happens to not share any one integer.
raiserror('Insert spt_values.type=''T  '' ....',0,1)
go
insert spt_values(name, number, type)
  values ('SYSPROTECTS.ACTION', 0, 'T')
insert spt_values(name, number, type)
  values ('References', 26, 'T')
insert spt_values(name, number, type)
  values ('Create Function', 178, 'T')
insert spt_values(name, number, type)
  values ('Select', 193, 'T')          --- action
insert spt_values(name, number, type)
  values ('Insert', 195, 'T')  --- Covers BCPin and LoadTable.
insert spt_values(name, number, type)
  values ('Delete', 196, 'T')
insert spt_values(name, number, type)
  values ('Update', 197, 'T')
insert spt_values(name, number, type)
  values ('Create Table', 198, 'T')
insert spt_values(name, number, type)
  values ('Create Database', 203, 'T')

insert spt_values(name, number, type)
  values ('Grant_WGO', 204, 'T')
insert spt_values(name, number, type)
  values ('Grant', 205, 'T')           --- protecttype
insert spt_values(name, number, type)
  values ('Deny', 206, 'T')

insert spt_values(name, number, type)
  values ('Create View', 207, 'T')
insert spt_values(name, number, type)
  values ('Create Procedure', 222, 'T')
insert spt_values(name, number, type)
  values ('Execute', 224, 'T')
insert spt_values(name, number, type)
  values ('Backup Database', 228, 'T')
insert spt_values(name, number, type)
  values ('Create Default', 233, 'T')
insert spt_values(name, number, type)
  values ('Backup Transaction', 235, 'T')
insert spt_values(name, number, type)
  values ('Create Rule', 236, 'T')

go

raiserror('Insert spt_values.type=''V  '' ....',0,1)
go
insert spt_values (name, number, type)
    values ('SYSDEVICES STATUS', 0, 'V')
insert spt_values (name, number, type)
    values ('default disk', 1, 'V')
insert spt_values (name, number, type)
    values ('physical disk', 2, 'V')
insert spt_values (name, number, type)
    values ('logical disk', 4, 'V')
insert spt_values (name, number, type)
    values ('backup device', 16, 'V')
insert spt_values (name, number, type)
    values ('serial writes', 32, 'V')
insert into spt_values(name, number, type, low, high)
    values ('read only', 4096, 'V', 0, 1)
insert into spt_values(name, number, type, low, high)
    values ('deferred', 8192, 'V', 0, 1)
go


-- Values for fixed server roles.
raiserror('Insert spt_values.type=''SRV'' ...',0,1)
go
insert spt_values(name, number, type, low)
  values ('sysadmin', 16, 'SRV', 0)
insert spt_values(name, number, type, low)
  values ('securityadmin', 32, 'SRV', 0)
insert spt_values(name, number, type, low)
  values ('serveradmin', 64, 'SRV', 0)
insert spt_values(name, number, type, low)
  values ('setupadmin', 128, 'SRV', 0)
insert spt_values(name, number, type, low)
  values ('processadmin', 256, 'SRV', 0)
insert spt_values(name, number, type, low)
  values ('diskadmin', 512, 'SRV', 0)
insert spt_values(name, number, type, low)
  values ('dbcreator', 1024, 'SRV', 0)
insert spt_values(name, number, type, low)
  values ('bulkadmin', 4096, 'SRV', 0)
go
-- UNDONE: REMOVE THESE (should be BOL only)
insert spt_values(name, number, type, low)
  values ('System Administrators', 16, 'SRV', -1)
insert spt_values(name, number, type, low)
  values ('Security Administrators', 32, 'SRV', -1)
insert spt_values(name, number, type, low)
  values ('Server Administrators', 64, 'SRV', -1)
insert spt_values(name, number, type, low)
  values ('Setup Administrators', 128, 'SRV', -1)
insert spt_values(name, number, type, low)
  values ('Process Administrators', 256, 'SRV', -1)
insert spt_values(name, number, type, low)
  values ('Disk Administrators', 512, 'SRV', -1)
insert spt_values(name, number, type, low)
  values ('Database Creators', 1024, 'SRV', -1)
insert spt_values(name, number, type, low)
  values ('Bulk Insert Administrators', 4096, 'SRV', -1)
go

-- Values for fixed db roles.
raiserror('Insert spt_values.type=''DBR'' ...',0,1)
go
-- UNDONE: REMOVE THESE (should be BOL only)
insert spt_values(name, number, type, low)
  values ('DB Owners', 16384, 'DBR', -1)
insert spt_values(name, number, type, low)
  values ('DB Access Administrators', 16385, 'DBR', -1)
insert spt_values(name, number, type, low)
  values ('DB Security Administrators', 16386, 'DBR', -1)
insert spt_values(name, number, type, low)
  values ('DB DDL Administrators', 16387, 'DBR', -1)
insert spt_values(name, number, type, low)
  values ('DB Backup Operator', 16389, 'DBR', -1)
insert spt_values(name, number, type, low)
  values ('DB Data Reader', 16390, 'DBR', -1)
insert spt_values(name, number, type, low)
  values ('DB Data Writer', 16391, 'DBR', -1)
insert spt_values(name, number, type, low)
  values ('DB Deny Data Reader', 16392, 'DBR', -1)
insert spt_values(name, number, type, low)
  values ('DB Deny Data Writer', 16393, 'DBR', -1)
go


-- SQL Server message group names stored in spt_values under type "LNG"
raiserror('Insert spt_values.type=''LNG'' ...',0,1)
go
insert into spt_values (name, number, type) values (N'Bulgarian', 1026, N'LNG')
insert into spt_values (name, number, type) values (N'Czech', 1029,  N'LNG')
insert into spt_values (name, number, type) values (N'Danish', 1030,  N'LNG')
insert into spt_values (name, number, type) values (N'German', 1031,  N'LNG')
insert into spt_values (name, number, type) values (N'Greek', 1032, N'LNG')
insert into spt_values (name, number, type) values (N'English', 1033, N'LNG')
insert into spt_values (name, number, type) values (N'Spanish', 3082,  N'LNG')
insert into spt_values (name, number, type) values (N'Finnish', 1035,  N'LNG')
insert into spt_values (name, number, type) values (N'French', 1036,  N'LNG')
insert into spt_values (name, number, type) values (N'Hungarian', 1038,  N'LNG')
insert into spt_values (name, number, type) values (N'Italian', 1040,  N'LNG')
insert into spt_values (name, number, type) values (N'japanese', 1041, N'LNG')
insert into spt_values (name, number, type) values (N'Dutch', 1043,  N'LNG')
insert into spt_values (name, number, type) values (N'Polish', 1045,  N'LNG')
insert into spt_values (name, number, type) values (N'Romanian', 1048,  N'LNG')
insert into spt_values (name, number, type) values (N'Russian', 1049, N'LNG')
insert into spt_values (name, number, type) values (N'Croatian', 1050,  N'LNG')
insert into spt_values (name, number, type) values (N'Slovak', 1051,  N'LNG')
insert into spt_values (name, number, type) values (N'Swedish', 1053,  N'LNG')
insert into spt_values (name, number, type) values (N'Turkish', 1055,  N'LNG')
insert into spt_values (name, number, type) values (N'Slovenian', 1060,  N'LNG')
insert into spt_values (name, number, type) values (N'Norwegian', 2068,  N'LNG')
insert into spt_values (name, number, type) values (N'Portuguese', 2070,  N'LNG')
insert into spt_values (name, number, type) values (N'Estonian', 1061,  N'LNG')
insert into spt_values (name, number, type) values (N'Latvian', 1062,  N'LNG')
insert into spt_values (name, number, type) values (N'Lithuanian', 1063,  N'LNG')
insert into spt_values (name, number, type) values (N'Brazilian', 1046,  N'LNG')
insert into spt_values (name, number, type) values (N'Traditional Chinese', 1028,  N'LNG')
insert into spt_values (name, number, type) values (N'Korean', 1042,  N'LNG')
insert into spt_values (name, number, type) values (N'Simplified Chinese', 2052,  N'LNG')
insert into spt_values (name, number, type) values (N'Arabic', 1025,  N'LNG')
insert into spt_values (name, number, type) values (N'Thai', 1054,  N'LNG')
go

-- Map SQL Trace ObjectType column to DDL Trigger Object Type
raiserror('Insert spt_values.type=''EOB'' ...',0,1)
go
insert into spt_values (name, number, type) values (N'AGGREGATE', 17985, N'EOB')  -- OBTYP_AGG
insert into spt_values (name, number, type) values (N'APPLICATION ROLE', 21057, N'EOB')  -- OBTYP_APPROLE
insert into spt_values (name, number, type) values (N'ASSEMBLY', 21313, N'EOB')  -- OBTYP_ASM
insert into spt_values (name, number, type) values (N'ASYMMETRIC KEY LOGIN', 19521, N'EOB')  -- OBTYP_AKEYLOGIN
insert into spt_values (name, number, type) values (N'ASYMMETRIC KEY USER', 21825, N'EOB')  -- OBTYP_AKEYUSER
insert into spt_values (name, number, type) values (N'ASYMMETRIC KEY', 19265, N'EOB')  -- OBTYP_ASYMKEY
insert into spt_values (name, number, type) values (N'CERTIFICATE LOGIN', 19523, N'EOB')  -- OBTYP_CERTLOGIN
insert into spt_values (name, number, type) values (N'CERTIFICATE USER', 21827, N'EOB')  -- OBTYP_CERTUSER
insert into spt_values (name, number, type) values (N'CERTIFICATE', 21059, N'EOB')  -- OBTYP_CERT
insert into spt_values (name, number, type) values (N'CHECK CONSTRAINT', 8259, N'EOB')  -- OBTYP_CHECK
insert into spt_values (name, number, type) values (N'CONTRACT', 21571, N'EOB')  -- OBTYP_CONTRACT
insert into spt_values (name, number, type) values (N'CREDENTIAL', 17475, N'EOB')  -- OBTYP_CREDENTIAL
insert into spt_values (name, number, type) values (N'DATABASE', 16964, N'EOB')  -- OBTYP_DATABASE
insert into spt_values (name, number, type) values (N'DEFAULT', 8260, N'EOB')  -- OBTYP_DEFAULT
insert into spt_values (name, number, type) values (N'ENDPOINT', 20549, N'EOB')  -- OBTYP_ENDPOINT
insert into spt_values (name, number, type) values (N'EVENT NOTIFICATION', 17491, N'EOB')  -- OBTYP_SRVEVTNOT
insert into spt_values (name, number, type) values (N'EVENT NOTIFICATION', 20036, N'EOB')  -- OBTYP_DBEVTNOT
insert into spt_values (name, number, type) values (N'EVENT NOTIFICATION', 20037, N'EOB')  -- OBTYP_EVTNOTIF
insert into spt_values (name, number, type) values (N'EVENT NOTIFICATION', 20047, N'EOB')  -- OBTYP_OBEVTNOT
insert into spt_values (name, number, type) values (N'FOREIGN KEY CONSTRAINT', 8262, N'EOB')  -- OBTYP_FKEY
insert into spt_values (name, number, type) values (N'FULLTEXT CATALOG', 17222, N'EOB')  -- OBTYP_FTCAT
insert into spt_values (name, number, type) values (N'FULLTEXT STOPLIST', 19526, N'EOB')  -- OTYP_FTSTPLIST
insert into spt_values (name, number, type) values (N'FUNCTION', 17993, N'EOB')  -- OBTYP_INLFUNC
insert into spt_values (name, number, type) values (N'FUNCTION', 18004, N'EOB')  -- OBTYP_TABFUNC
insert into spt_values (name, number, type) values (N'FUNCTION', 20038, N'EOB')  -- OBTYP_FUNCTION
insert into spt_values (name, number, type) values (N'FUNCTION', 21318, N'EOB')  -- OBTYP_FNSCLASM
insert into spt_values (name, number, type) values (N'FUNCTION', 21321, N'EOB')  -- OBTYP_INLSCLFN
insert into spt_values (name, number, type) values (N'FUNCTION', 21574, N'EOB')  -- OBTYP_FNTABASM
insert into spt_values (name, number, type) values (N'GROUP USER', 21831, N'EOB')  -- OBTYP_GROUPUSER
insert into spt_values (name, number, type) values (N'INDEX', 22601, N'EOB')  -- OBTYP_INDEX
insert into spt_values (name, number, type) values (N'LOGIN', 22604, N'EOB')  -- OBTYP_LOGIN
insert into spt_values (name, number, type) values (N'MASTER KEY', 19277, N'EOB')  -- OBTYP_MASTERKEY
insert into spt_values (name, number, type) values (N'DATABASE ENCRYPTION KEY', ASCII('D') + ASCII('K')*256, N'EOB')  -- OTYP_DEK
insert into spt_values (name, number, type) values (N'MESSAGE TYPE', 21581, N'EOB')  -- OBTYP_MSGTYPE
insert into spt_values (name, number, type) values (N'OBJECT', 16975, N'EOB')  -- OBTYP_OBJ
insert into spt_values (name, number, type) values (N'PARTITION FUNCTION', 18000, N'EOB')  -- OBTYP_PFUN
insert into spt_values (name, number, type) values (N'BROKER PRIORITY', 21072, N'EOB')  -- OBTYP_PRIORITY
insert into spt_values (name, number, type) values (N'PARTITION SCHEME', 21328, N'EOB')  -- OBTYP_PSCHEME
insert into spt_values (name, number, type) values (N'PRIMARY KEY', 19280, N'EOB')  -- OBTYP_PRKEY
insert into spt_values (name, number, type) values (N'QUEUE', 20819, N'EOB')  -- OBTYP_SVCQ
insert into spt_values (name, number, type) values (N'REMOTE SERVICE BINDING', 20034, N'EOB')  -- OBTYP_BINDING
insert into spt_values (name, number, type) values (N'ROLE', 19538, N'EOB')  -- OBTYP_ROLE
insert into spt_values (name, number, type) values (N'ROUTE', 21586, N'EOB')  -- OBTYP_ROUTE
insert into spt_values (name, number, type) values (N'RULE', 8274, N'EOB')  -- OBTYP_RULE
insert into spt_values (name, number, type) values (N'SCHEMA', 17235, N'EOB')  -- OBTYP_SCHEMA
insert into spt_values (name, number, type) values (N'SERVER ROLE', 18259, N'EOB')  -- OBTYP_SRVROLE
insert into spt_values (name, number, type) values (N'SERVER', 21075, N'EOB')  -- OBTYP_SERVER
insert into spt_values (name, number, type) values (N'SERVICE', 22099, N'EOB')  -- OBTYP_SERVICE
insert into spt_values (name, number, type) values (N'SQL LOGIN', 19539, N'EOB')  -- OBTYP_SQLLOGIN
insert into spt_values (name, number, type) values (N'SQL USER', 21333, N'EOB')  -- OBTYP_USER
insert into spt_values (name, number, type) values (N'SQL USER', 21843, N'EOB')  -- OBTYP_SQLUSER
insert into spt_values (name, number, type) values (N'STATISTICS', 21587, N'EOB')  -- OBTYP_STATISTICS
insert into spt_values (name, number, type) values (N'STORED PROCEDURE', 17232, N'EOB')  -- OBTYP_PROCASM
insert into spt_values (name, number, type) values (N'STORED PROCEDURE', 18002, N'EOB')  -- OBTYP_REPLPROC
insert into spt_values (name, number, type) values (N'STORED PROCEDURE', 8272, N'EOB')  -- OBTYP_PROC
insert into spt_values (name, number, type) values (N'STORED PROCEDURE', 8280, N'EOB')  -- OBTYP_XPROC
insert into spt_values (name, number, type) values (N'SYMMETRIC KEY', 19283, N'EOB')  -- OBTYP_OBFKEY
insert into spt_values (name, number, type) values (N'SYNONYM', 20051, N'EOB')  -- OBTYP_SYNONYM
insert into spt_values (name, number, type) values (N'TABLE', 8275, N'EOB')  -- OBTYP_SYSTAB
insert into spt_values (name, number, type) values (N'TABLE', 8277, N'EOB')  -- OBTYP_USRTAB
insert into spt_values (name, number, type) values (N'TRIGGER', 16724, N'EOB')  -- OBTYP_TRIGASM
insert into spt_values (name, number, type) values (N'TRIGGER', 21076, N'EOB')  -- OBTYP_TRIGGER
insert into spt_values (name, number, type) values (N'TRIGGER', 21572, N'EOB')  -- OBTYP_DBTRIG
insert into spt_values (name, number, type) values (N'TRIGGER', 8276, N'EOB')  -- OBTYP_SRVTRIG
insert into spt_values (name, number, type) values (N'TYPE', 22868, N'EOB')  -- OBTYP_TYPE
insert into spt_values (name, number, type) values (N'UNIQUE CONSTRAINT', 20821, N'EOB')  -- OBTYP_UQKEY
insert into spt_values (name, number, type) values (N'VIEW', 8278, N'EOB')  -- OBTYP_VIEW
insert into spt_values (name, number, type) values (N'WINDOWS GROUP', 18263, N'EOB')  -- OBTYP_WINGROUP
insert into spt_values (name, number, type) values (N'WINDOWS LOGIN', 19543, N'EOB')  -- OBTYP_WINLOGIN
insert into spt_values (name, number, type) values (N'WINDOWS USER', 21847, N'EOB')  -- OBTYP_WINUSER
insert into spt_values (name, number, type) values (N'XML SCHEMA COLLECTION', 22611, N'EOB')  -- OBTYP_XMLSCHEMA
insert into spt_values (name, number, type) values (N'EVENT SESSION', ASCII('S') + ASCII('E')*256, N'EOB')  -- OTYP_SRVXESES = 17747
insert into spt_values (name, number, type) values (N'RESOURCE GOVERNOR', ASCII('R') + ASCII('G')*256, N'EOB')  -- OTYP_RG
insert into spt_values (name, number, type) values (N'DATABASE AUDIT SPECIFICATION', ASCII('D') + ASCII('A')*256, N'EOB')  -- OTYP_DBAUDITSPEC
insert into spt_values (name, number, type) values (N'SERVER AUDIT SPECIFICATION', ASCII('S') + ASCII('A')*256, N'EOB')  -- OTYP_SRVAUDITSPEC
insert into spt_values (name, number, type) values (N'SERVER AUDIT', ASCII('A') + ASCII(' ')*256, N'EOB')  -- OTYP_AUDIT
insert into spt_values (name, number, type) values (N'CRYPTOGRAPHIC PROVIDER', ASCII('C') + ASCII('P')*256, N'EOB')  -- OTYP_CRYPTOPROVIDER
insert into spt_values (name, number, type) values (N'SERVER CONFIG', ASCII('C') + ASCII('O')*256, N'EOB')  -- OTYP_SRVCONFIG
go


-- Map an Audit object_type column an human readable object type string
-- Note that this relies on EOB entried defined above.  The only difference
-- is that it is not "lossy" in the mapping by overriding some of the EOB entries that
-- map to duplicate strings
--
-- These strings are used to implement the security audit views sys.dm_audit_actions
-- and sys.dm_audit_class_type_map.
--
-- 'EOD' is short for EObjType Description.
--
raiserror('Insert spt_values.type=''EOD'' ...',0,1)
go
insert into spt_values (name, number, type) select name, number, N'EOD' from spt_values where type = N'EOB'
--missing items
--
insert into spt_values (name, number, type) values (N'XREL TREE', 21080, N'EOD')  -- OTYP_XREL
insert into spt_values (name, number, type) values (N'ADHOC QUERY', ASCII('A') + ASCII('Q')*256, N'EOD')  -- OTYP_ADHOC
insert into spt_values (name, number, type) values (N'INTERNAL TABLE', ASCII('I') + ASCII('T')*256, N'EOD')  -- OTYP_INTLTAB
insert into spt_values (name, number, type) values (N'PREPARED ADHOC QUERY', ASCII('P') + ASCII('Q')*256, N'EOD')  -- OTYP_PREPARED
-- What is this one - doesn't seem to be used in the code
insert into spt_values (name, number, type) values (N'Undocumented', ASCII('A') + ASCII('P')*256, N'EOD')  -- OTYP_APP
--Fixups for duplicates under type 'EOB' above.
--
update spt_values set name = N'USER' where number =  21333 and type = N'EOD'  -- OBTYP_USER
update spt_values set name = N'EVENT NOTIFICATION SERVER' where number =  17491 and type = N'EOD'  -- OBTYP_SRVEVTNOT
update spt_values set name = N'EVENT NOTIFICATION DATABASE' where number =  20036 and type = N'EOD'  -- OBTYP_DBEVTNOT
update spt_values set name = N'EVENT NOTIFICATION OBJECT' where number =  20047 and type = N'EOD'  -- OBTYP_OBEVTNOT
update spt_values set name = N'FUNCTION SCALAR SQL' where number =  20038 and type = N'EOD'  -- OBTYP_FUNCTION
update spt_values set name = N'FUNCTION TABLE-VALUED INLINE SQL' where number =  17993 and type = N'EOD'  -- OBTYP_INLFUNC
update spt_values set name = N'FUNCTION TABLE-VALUED SQL' where number =  18004 and type = N'EOD'  -- OBTYP_TABFUNC
update spt_values set name = N'FUNCTION SCALAR ASSEMBLY ' where number =  21318 and type = N'EOD'  -- OBTYP_FNSCLASM
update spt_values set name = N'FUNCTION SCALAR INLINE SQL ' where number =  21321 and type = N'EOD'  -- OBTYP_INLSCLFN
update spt_values set name = N'FUNCTION TABLE-VALUED ASSEMBLY ' where number =  21574 and type = N'EOD'  -- OBTYP_FNTABASM
update spt_values set name = N'STORED PROCEDURE ASSEMBLY' where number =  17232 and type = N'EOD'  -- OBTYP_PROCASM
update spt_values set name = N'STORED PROCEDURE REPLICATION FILTER' where number =  18002 and type = N'EOD'  -- OBTYP_REPLPROC
update spt_values set name = N'STORED PROCEDURE EXTENDED' where number =  8280 and type = N'EOD'  -- OBTYP_XPROC
update spt_values set name = N'TABLE SYSTEM' where number =  8275 and type = N'EOD'  -- OBTYP_SYSTAB
update spt_values set name = N'TRIGGER ASSEMBLY' where number =  16724 and type = N'EOD'  -- OBTYP_TRIGASM
update spt_values set name = N'TRIGGER DATABASE' where number =  21572 and type = N'EOD'  -- OBTYP_DBTRIG
update spt_values set name = N'TRIGGER SERVER' where number =  8276 and type = N'EOD'  -- OBTYP_SRVTRIG

update statistics spt_values
go

-- Extended events default session
if exists(select * from sys.server_event_sessions where name='system_health')
    drop event session system_health on server
go
-- The predicates in this session have been carefully crafted to minimize impact of event collection
-- Changing the predicate definition may impact system performance
--
create event session system_health on server
add event sqlserver.error_reported
(
    action (package0.callstack, sqlserver.session_id, sqlserver.sql_text, sqlserver.tsql_stack)
    -- Get callstack, SPID, and query for all high severity errors ( above sev 20 )
    where severity >= 20
    -- Get callstack, SPID, and query for OOM errors ( 17803 , 701 , 802 , 8645 , 8651 , 8657 , 8902 )
    or (error = 17803 or error = 701 or error = 802 or error = 8645 or error = 8651 or error = 8657 or error = 8902)
),
add event sqlos.scheduler_monitor_non_yielding_ring_buffer_recorded,
add event sqlserver.xml_deadlock_report,
add event sqlos.wait_info
(
    action (package0.callstack, sqlserver.session_id, sqlserver.sql_text)
    where
    (duration > 15000 and
        (
            (wait_type > 31    -- Waits for latches and important wait resources (not locks ) that have exceeded 15 seconds.
                and
                (
                    (wait_type > 47 and wait_type < 54)
                    or wait_type < 38
                    or (wait_type > 63 and wait_type < 70)
                    or (wait_type > 96 and wait_type < 100)
                    or (wait_type = 107)
                    or (wait_type = 113)
                    or (wait_type > 174 and wait_type < 179)
                    or (wait_type = 186)
                    or (wait_type = 207)
                    or (wait_type = 269)
                    or (wait_type = 283)
                    or (wait_type = 284)
                )
            )
            or
            (duration > 30000        -- Waits for locks that have exceeded 30 secs.
                and wait_type < 22
            )
        )
    )
),
add event sqlos.wait_info_external
(
    action (package0.callstack, sqlserver.session_id, sqlserver.sql_text)
    where
    (duration > 5000 and
        (
            (    -- Login related preemptive waits that have exceeded 5 seconds.
                (wait_type > 365 and wait_type < 372)
                or    (wait_type > 372 and wait_type < 377)
                or    (wait_type > 377 and wait_type < 383)
                or    (wait_type > 420 and wait_type < 424)
                or    (wait_type > 426 and wait_type < 432)
                or    (wait_type > 432 and wait_type < 435)
            )
            or
            (duration > 45000     -- Preemptive OS waits that have exceeded 45 seconds.
                and
                (
                    (wait_type > 382 and wait_type < 386)
                    or    (wait_type > 423 and wait_type < 427)
                    or    (wait_type > 434 and wait_type < 437)
                    or    (wait_type > 442 and wait_type < 451)
                    or    (wait_type > 451 and wait_type < 473)
                    or    (wait_type > 484 and wait_type < 499)
                    or wait_type = 365
                    or wait_type = 372
                    or wait_type = 377
                    or wait_type = 387
                    or wait_type = 432
                    or wait_type = 502
                )
            )
        )
    )
)
add target package0.ring_buffer        -- Store events in the ring buffer target
    (set max_memory = 4096)
with (startup_state = on)
go

declare @vdt varchar(99)
select  @vdt = convert(varchar,getdate(),113)
raiserror('Finishing at  %s',0,1,@vdt)
go

checkpoint
go
(These appear in the SQL Server error log as error 17883.)
1262:报告17883错误,获取更多nonyield的信息,产生mini dump,产生mini dump会增加I/O开销,SchedulerMonitor 的两个阶段
SQL Server2012添加了两个对SQL CLR监控的事件到 system_health session
The system_health Session
--http://www.sqlskills.com/blogs/jonathan/an-xevent-a-day-13-of-31-the-system_health-session/
分别是
A SQLCLR memory allocation failed.
ADD EVENT sqlclr.allocation_failure,
A SQLCLR virtual memory allocation failed.
ADD EVENT sqlclr.virtual_alloc_failure
Today’s post was originally planned for this coming weekend, but seems I’ve caught whatever bug my kids had over the weekend so I am changing up today’s blog post with one that is easier to cover and shorter.  If you’ve been running some of the queries from the posts in this series, you have no doubt come across an Event Session running on your server with the name of system_health.  In today’s post I’ll go over this session and provide links to references related to it.

When Extended Events was introduced in SQL Server 2008, the Produce Support Services group worked with the Extended Events developers to create the definition for an Event Session that could be shipped with SQL Server 2008, would startup automatically when SQL Server starts up, and contained Events of interest in troubleshooting common problems seen by the PSS Engineers.  Bob Ward (Blog|Twitter) blogged about the details of the system_health session that shipped with SQL Server 2008 in his blog post Supporting SQL Server 2008: The system_health session.  The script for this Event Session is inside of the utables.sql script file that is in the instance Install folder (for example c:\Program Files\Microsoft SQL Server\<InstanceDesignator>\MSSQL\Install) and can be used to recreate the Event Session if you inadvertently change it.

-- The predicates in this session have been carefully crafted to minimize impact of event collection
-- Changing the predicate definition may impact system performance
--
CREATE EVENT SESSION system_health ON SERVER
The sql_text and session_id for any sessions that encounter an error that has a severity >=20.
The sql_text and session_id for any sessions that encounter a memory-related error. The errors include 17803, 701, 802, 8645, 8651, 8657 and 8902.
ADD EVENT sqlserver.error_reported
(
    ACTION (package0.callstack, sqlserver.session_id, sqlserver.sql_text, sqlserver.tsql_stack)
    -- Get callstack, SPID, and query for all high severity errors ( above sev 20 )
    WHERE severity >= 20
    -- Get callstack, SPID, and query for OOM errors ( 17803 , 701 , 802 , 8645 , 8651 , 8657 , 8902 )
    OR (ERROR = 17803 OR ERROR = 701 OR ERROR = 802 OR ERROR = 8645 OR ERROR = 8651 OR ERROR = 8657 OR ERROR = 8902)
),
A record of any non-yielding scheduler problems. (These appear in the SQL Server error log as error 17883.)
ADD EVENT sqlos.scheduler_monitor_non_yielding_ring_buffer_recorded,
Any deadlocks that are detected.
ADD EVENT sqlserver.xml_deadlock_report,
The callstack, sql_text, and session_id for any sessions that have waited on latches (or other interesting resources) for > 15 seconds.
ADD EVENT sqlos.wait_info
(
    ACTION (package0.callstack, sqlserver.session_id, sqlserver.sql_text)
    WHERE
    (duration > 15000 AND
        (
            (wait_type > 31    -- Waits for latches and important wait resources (not locks ) that have exceeded 15 seconds.
                AND
                (
                    (wait_type > 47 AND wait_type < 54)
                    OR wait_type < 38
                    OR (wait_type > 63 AND wait_type < 70)
                    OR (wait_type > 96 AND wait_type < 100)
                    OR (wait_type = 107)
                    OR (wait_type = 113)
                    OR (wait_type > 174 AND wait_type < 179)
                    OR (wait_type = 186)
                    OR (wait_type = 207)
                    OR (wait_type = 269)
                    OR (wait_type = 283)
                    OR (wait_type = 284)
                )
            )
The callstack, sql_text, and session_id for any sessions that have waited on locks for > 30 seconds.
            OR
            (duration > 30000        -- Waits for locks that have exceeded 30 secs.
                AND wait_type < 22
            )
        )
    )
),
The callstack, sql_text, and session_id for any sessions that have waited for a long time for preemptive waits. The duration varies by wait type. A preemptive wait is where SQL Server is waiting for external API calls.
ADD EVENT sqlos.wait_info_external
(
    ACTION (package0.callstack, sqlserver.session_id, sqlserver.sql_text)
    WHERE
    (duration > 5000 AND
        (
            (    -- Login related preemptive waits that have exceeded 5 seconds.
                (wait_type > 365 AND wait_type < 372)
                OR    (wait_type > 372 AND wait_type < 377)
                OR    (wait_type > 377 AND wait_type < 383)
                OR    (wait_type > 420 AND wait_type < 424)
                OR    (wait_type > 426 AND wait_type < 432)
                OR    (wait_type > 432 AND wait_type < 435)
            )
            OR
            (duration > 45000     -- Preemptive OS waits that have exceeded 45 seconds.
                AND
                (
                    (wait_type > 382 AND wait_type < 386)
                    OR    (wait_type > 423 AND wait_type < 427)
                    OR    (wait_type > 434 AND wait_type < 437)
                    OR    (wait_type > 442 AND wait_type < 451)
                    OR    (wait_type > 451 AND wait_type < 473)
                    OR    (wait_type > 484 AND wait_type < 499)
                    OR wait_type = 365
                    OR wait_type = 372
                    OR wait_type = 377
                    OR wait_type = 387
                    OR wait_type = 432
                    OR wait_type = 502
                )
            )
        )
    )
)
Capture Event information using the ring_buffer target.
ADD target package0.ring_buffer        -- Store events in the ring buffer target
    (SET max_memory = 4096)
Set the session to start automatically with SQL Server
WITH (startup_state = ON)
GO
In SQL Server Denali CTP1, two new Events have been added to the system_health session specific to SQLCLR.

A SQLCLR memory allocation failed.
ADD EVENT sqlclr.allocation_failure,
A SQLCLR virtual memory allocation failed.
ADD EVENT sqlclr.virtual_alloc_failure,
While the system_health session captures very useful information, it uses the ring_buffer Target to store the Event data.  In a scenario where the database engine fails completely the information that may have been captured by the system_health session will be lost when the process terminates.  Also since the Event Session uses the ring_buffer Target, it is possible that you may not receive back all of the Event data contained in the target, or the Events that you might have expected to exist.  Bob Ward talked about the limitation of the DMV’s to return 4MB of XML data and how this impacts the in memory Targets in Extended Events in his blog post You may not see the data you expect in Extended Event Ring Buffer Targets….

One of my favorite aspects of the system_health session is that it includes deadlock tracing through Extended Events by default.  However, in order to make use of the deadlock graph captured by Extended Events, you have to be on CU6 for SQL Server 2008 SP1 (http://support.microsoft.com/kb/978629), or you could try to hack your way around the bug as I showed in my article Retrieving Deadlock Graphs with SQL Server 2008 Extended Events, and Michael Zilberstein’s update to correct a problem with the code in that article, Parsing Extended Events xml_deadlock_report.  The deadlock graph in Extended Events will not open graphically in SSMS like a SQL Trace XML Deadlock Graph will due to changes in its output to support multi-victim deadlocks, which I covered in my blog post Changes to the Deadlock Monitor for the Extended Events xml_deadlock_report and Multi-Victim Deadlocks.
A Closer Look at Predicates
A Closer Look at Predicates
--http://www.sqlskills.com/blogs/jonathan/an-xevent-a-day-14-of-31-a-closer-look-at-predicates/
研究过滤谓词
When working with SQL Trace, one of my biggest frustrations has been the limitations that exist in filtering.  Using sp_trace_setfilter to establish the filter criteria is a non-trivial task, and it falls short of being able to deliver complex filtering that is sometimes needed to simplify analysis.  Filtering of trace data was performed globally and applied to the trace affecting all of the events being collected.  Extended Events introduces a much better system of filtering using Predicates that are applied at the individual Event level, allow for short circuiting of evaluation, and provide the ability to create complex groups of independent criteria, ensuring only Events of interest are captured by the Event Session.

In yesterdays post, The system_health Session, I talked about the default system_health session that is running on every SQL Server 2008/2008R2 and Denali CTP1 instance out of the box.  The Predicate definition for the sqlos.wait_info event in the system_health session is a good example to follow for complex, short-circuiting Predicate definition in Extended Events.

ADD EVENT sqlos.wait_info
(
    ACTION (package0.callstack, sqlserver.session_id, sqlserver.sql_text)
    WHERE
    (duration > 15000 AND
        (
            (wait_type > 31    -- Waits for latches and important wait resources (not locks)
                            -- that have exceeded 15 seconds.
                AND
                (
                    (wait_type > 47 AND wait_type < 54)
                    OR wait_type < 38
                    OR (wait_type > 63 AND wait_type < 70)
                    OR (wait_type > 96 AND wait_type < 100)
                    OR (wait_type = 107)
                    OR (wait_type = 113)
                    OR (wait_type > 174 AND wait_type < 179)
                    OR (wait_type = 186)
                    OR (wait_type = 207)
                    OR (wait_type = 269)
                    OR (wait_type = 283)
                    OR (wait_type = 284)
                )
            )
            OR
            (duration > 30000        -- Waits for locks that have exceeded 30 secs.
                AND wait_type < 22
            )
        )
    )
),
Since Predicates perform short-circuit evaluation, where the criteria groups are evaluated in order and the first failure in the criteria causes the Predicate evaluation to stop and preventing the Event from being fired in the engine, the order of the criteria can directly impact the performance of an Event Session.  If we look at the definition for the sqlos.wait_info Event, the first Predicate criteria specifies that the duration of the wait has to be greater than 15 seconds.  Since the majority of waits in SQL Server generally occur with durations less than 15 seconds, the Predicate evaluations shortcut immediately and the Event does not fire.  If the wait exceeds the 15 second duration, the evaluation continues and checks that the wait_type matches one of defined values.  How do we know what these values are?

When looking at an Event, all of the columns have a type_name associated with them that can be found in the sys.dm_xe_object_columns DMV as previously discussed in this series.  If we take a look at the type_name for the wait_info Event wait_type column, we’ll see that it has a type of wait_types.

SELECT
    name,
    type_name,
    column_type
FROM sys.dm_xe_object_columns
WHERE object_name = 'wait_info'
  AND column_type <> 'readonly'
An XEvent a Day (14 of 31) – A Closer Look at Predicates   image thumb
When a column has a non-standard type_name like this, it corresponds to a Map that has been loaded in Extended Events.  We can find a list of the wait_types that the Event will fire for by querying the sys.dm_xe_map_values DMV for the map_keys defined in the Event Session:

SELECT map_key, map_value
FROM sys.dm_xe_map_values
WHERE name = 'wait_types'
  AND
    (map_key > 31    -- Waits for latches and important wait resources (not locks)
                    -- that have exceeded 15 seconds.
        AND
        (
            (map_key > 47 AND map_key < 54)
            OR map_key < 38
            OR (map_key > 63 AND map_key < 70)
            OR (map_key > 96 AND map_key < 100)
            OR (map_key = 107)
            OR (map_key = 113)
            OR (map_key > 174 AND map_key < 179)
            OR (map_key = 186)
            OR (map_key = 207)
            OR (map_key = 269)
            OR (map_key = 283)
            OR (map_key = 284)
        )
    )
The wait_types that correspond to the first complex grouping are:

map_key    map_value
32    LATCH_NL
33    LATCH_KP
34    LATCH_SH
35    LATCH_UP
36    LATCH_EX
37    LATCH_DT
48    PAGELATCH_NL
49    PAGELATCH_KP
50    PAGELATCH_SH
51    PAGELATCH_UP
52    PAGELATCH_EX
53    PAGELATCH_DT
64    PAGEIOLATCH_NL
65    PAGEIOLATCH_KP
66    PAGEIOLATCH_SH
67    PAGEIOLATCH_UP
map_key    map_value
68    PAGEIOLATCH_EX
69    PAGEIOLATCH_DT
97    IO_COMPLETION
98    ASYNC_IO_COMPLETION
99    NETWORK_IO
107    RESOURCE_SEMAPHORE
113    SOS_WORKER
175    FCB_REPLICA_WRITE
176    FCB_REPLICA_READ
177    HOLDER11
178    WRITELOG
186    CMEMTHREAD
207    TRACEWRITE
269    RESOURCE_SEMAPHORE_MUTEX
283    RESOURCE_SEMAPHORE_QUERY_COMPILE
284    RESOURCE_SEMAPHORE_SMALL_QUERY
If you look at the way the Predicate is defined, it is much closer to how you’d write a WHERE clause with complex filtering criteria, allowing groups of specific criteria to be defined within sets of parenthesis’s that are evaluated together, something that was impossible with SQL Trace.

In addition to being able to define Predicates based on the Event columns returned by an Event, it is possible to also define Predicates on the global state data available in the Extended Events Engine.  If you’ll recall, the global state predicates are available in the sys.dm_xe_objects DMV as pred_source object_type’s.

SELECT
    p.name AS package_name,
    o.name AS predicate_name,
    o.description
FROM sys.dm_xe_packages AS p
INNER JOIN sys.dm_xe_objects AS o
    ON p.guid = o.package_guid
WHERE (p.capabilities IS NULL OR p.capabilities & 1 = 0)
  AND o.object_type = 'pred_source'
     An XEvent a Day (14 of 31) – A Closer Look at Predicates   image thumb
Two of the predicate sources are special, the package0.counter and package0.partitioned_counter, and can be used to restrict the number of occurrences of an Events that are captured by an Event Session.  The following demonstration creates an Event Session that captures the first five occurrences of the sqlserver.sql_statement_completed Event, and then executes six statements in sequence.  When the target_data is queried the last statement SELECT @@SPID is not included in the results.

CREATE EVENT SESSION CounterPredicateDemo
ON SERVER
ADD EVENT sqlserver.sql_statement_completed
( ACTION (sqlserver.sql_text)
  WHERE (package0.counter <=5))
ADD TARGET package0.ring_buffer
WITH (MAX_DISPATCH_LATENCY = 1 SECONDS)
GO
ALTER EVENT SESSION CounterPredicateDemo
ON SERVER
STATE = START
GO
SELECT @@VERSION
GO
SELECT @@SERVERNAME
GO
SELECT @@SPID
GO
SELECT @@VERSION
GO
SELECT @@SERVERNAME
GO
SELECT @@SPID
GO
ALTER EVENT SESSION CounterPredicateDemo
ON SERVER
DROP EVENT sqlserver.sql_statement_completed
GO
-- Wait in a delay for Events to Buffer
WAITFOR DELAY '00:00:05'
GO

-- Query the XML to get the Target Data
SELECT
    n.value('(event/@name)[1]', 'varchar(50)') AS event_name,
    n.value('(event/@package)[1]', 'varchar(50)') AS package_name,
    DATEADD(hh,
            DATEDIFF(hh, GETUTCDATE(), CURRENT_TIMESTAMP),
            n.value('(event/@timestamp)[1]', 'datetime2')) AS [timestamp],
    n.value('(event/data[@name="object_id"]/value)[1]', 'int') AS [object_id],
    n.value('(event/data[@name="object_type"]/value)[1]', 'nvarchar(128)') AS [object_type],
    n.value('(event/data[@name="duration"]/value)[1]', 'int') AS [duration],
    n.value('(event/data[@name="cpu"]/value)[1]', 'int') AS [cpu],
    n.value('(event/data[@name="reads"]/value)[1]', 'int') AS [reads],
    n.value('(event/data[@name="writes"]/value)[1]', 'int') AS [writes],
    n.value('(event/action[@name="sql_text"]/value)[1]', 'nvarchar(max)') AS [sql_text]
FROM
(    SELECT td.query('.') as n
    FROM
    (
        SELECT CAST(target_data AS XML) as target_data
        FROM sys.dm_xe_sessions AS s
        JOIN sys.dm_xe_session_targets AS t
            ON t.event_session_address = s.address
        WHERE s.name = 'CounterPredicateDemo'
          AND t.target_name = 'ring_buffer'
    ) AS sub
    CROSS APPLY target_data.nodes('RingBufferTarget/event') AS q(td)
) as tab
GO
-- Drop the Event Session
DROP EVENT SESSION CounterPredicateDemo
ON SERVER
An XEvent a Day (14 of 31) – A Closer Look at Predicates   image thumb

This capabilities behind Predicate definition in Extended Events makes it much more flexible, and powerful for troubleshooting than SQL Trace.  It also makes Extended Events much more performant than Trace by preempting Event firing for Events that are not of interest.
Tracking Ghost Cleanup
--http://www.sqlskills.com/blogs/jonathan/an-xevent-a-day-15-of-31-tracking-ghost-cleanup/
sql2005每5秒运行一次ghost cleanup 进程
sql2008每10秒运行一次ghost cleanup 进程
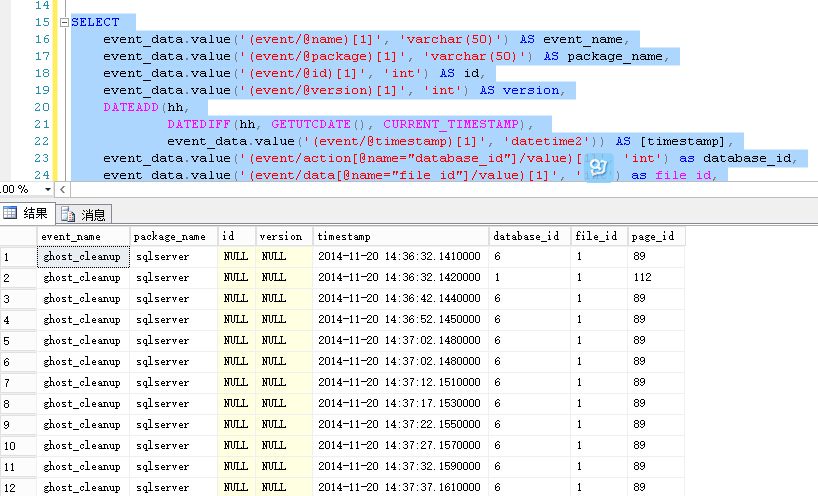
If you don’t know anything about Ghost Cleanup, I recommend highly that you go read Paul Randal’s blog posts Inside the Storage Engine: Ghost cleanup in depth, Ghost cleanup redux, and Turning off the ghost cleanup task for a performance gain.  To my knowledge Paul’s posts are the only things that cover Ghost Cleanup at any level online.

In this post we’ll look at how you can use Extended Events to track the activity of Ghost Cleanup inside of your SQL Server.  To do this, we’ll first take a look at the ghost_cleanup Event and what it returns.

-- Find the Event
SELECT
    p.name,
    o.name,
    o.description
FROM sys.dm_xe_packages AS p
JOIN sys.dm_xe_objects AS o
    ON p.guid = o.package_guid
WHERE o.name = 'ghost_cleanup'

-- Get the data columns for the Event
SELECT
    name,
    TYPE_NAME
FROM sys.dm_xe_object_columns
WHERE OBJECT_NAME = 'ghost_cleanup'
  AND column_type = 'data'
An XEvent a Day (15 of 31)   Tracking Ghost Cleanup   image thumb

The ghost_cleanup Event is in the sqlserver Package and returns the file_id and page_id that the ghost cleanup process is working on.  Since most SQL Servers have multiple databases, we probably will want to track the database_id through an Action as well.  Since ghost cleanup is a background process, and we don’t know much about how it works, or how many Events are going to be generated, we could start off with the synchronous_event_counter Target, but in this case, I just want to capture Events and all of them, so we will just go with the asynchronous_file_target.

CREATE EVENT SESSION TrackGhostCleanup
ON SERVER
ADD EVENT sqlserver.ghost_cleanup
( ACTION(sqlserver.database_id))
ADD TARGET package0.asynchronous_file_target(
     SET filename='C:\SQLBlog\TrackGhostCleanup.xel',
         metadatafile='C:\SQLBlog\TrackGhostCleanup.xem')
WITH (MAX_MEMORY = 4MB, EVENT_RETENTION_MODE = NO_EVENT_LOSS )
GO
ALTER EVENT SESSION TrackGhostCleanup
ON SERVER
STATE=START
This is a really basic Event Session, it captures one Event, sqlserver.ghost_cleanup and collects the sqlserver.database_id Action when the Event fires.  The Event data is captured by the package0.asynchronous_file_target, and the Event Session is configured to not allow Event Loss.  After the starting the Event Session and allowing it to run, we can query the files for the captured events and see how ghost_cleanup is running on our instance.

-- Query the Event data from the Target.
SELECT
    event_data.value('(event/@name)[1]', 'varchar(50)') AS event_name,
    event_data.value('(event/@package)[1]', 'varchar(50)') AS package_name,
    event_data.value('(event/@id)[1]', 'int') AS id,
    event_data.value('(event/@version)[1]', 'int') AS version,
    DATEADD(hh,
            DATEDIFF(hh, GETUTCDATE(), CURRENT_TIMESTAMP),
            event_data.value('(event/@timestamp)[1]', 'datetime2')) AS [timestamp],
    event_data.value('(event/action[@name="database_id"]/value)[1]', 'int') as database_id,
    event_data.value('(event/data[@name="file_id"]/value)[1]', 'int') as file_id,
    event_data.value('(event/data[@name="page_id"]/value)[1]', 'int') as page_id
FROM
(SELECT
    CAST(event_data AS XML) AS event_data
 FROM sys.fn_xe_file_target_read_file('C:\SQLBlog\TrackGhostCleanup*.xel', 'C:\SQLBlog\TrackGhostCleanup*xem', null, null)
) as tab
From around 15 minutes of runtime on one of my development servers, over 17.5K Events have fired, much more than I initially anticipated, and after nearly 30 minutes of runtime, I had just over 37K Events.

An XEvent a Day (15 of 31)   Tracking Ghost Cleanup   image thumb

Some interesting information can be found in the Events.  In SQL Server 2008, the Ghost Cleanup process runs every 10 seconds, just as Paul has documented in his blog posts, which was a change from every 5 seconds in SQL Server 2005.

An XEvent a Day (15 of 31)   Tracking Ghost Cleanup   image thumb

The process in 2008 cleans up 200 pages at a time, something Paul hasn’t specifically blogged about for SQL Server 2008.  Before anyone debates this, Paul’s statement “It will check through or cleanup a limited number of pages each time it wakes up – I remember the limit is 10 pages – to ensure it doesn’t swamp the system.” from his Inside the Storage Engine: Ghost cleanup in depth is based on SQL Server 2005, which also ran ghost cleanup every 5 seconds instead of 10 seconds.  We can look at the Event information over subsequent 10 second intervals and see that 200 pages are cleaned up each time ghost_cleanup runs.

An XEvent a Day (15 of 31)   Tracking Ghost Cleanup   image thumb

An XEvent a Day (15 of 31)   Tracking Ghost Cleanup   image thumb

This has to be one of my favorite aspects of Extended Events.  You get to really learn about SQL Server Internals by just playing with SQL Server.  I have a couple more blog posts that show how you can learn about SQL Server Internals using Extended Events for this series, and if you are interested in a previous post on the subject check out TSQL Tuesday #11 – Physical IO’s Don’t Always Accumulate Wait Times.

Until tomorrow….
How Many Checkpoints are Issued During a Full Backup?
http://www.sqlskills.com/blogs/jonathan/an-xevent-a-day-16-of-31-how-many-checkpoints-are-issued-during-a-full-backup/
在一个完整备份期间有多少个检查点被触发
跟数据库备份有关的事件: sqlserver.databases_backup_restore_throughput
sqlserver.sql_statement_starting
sqlserver.sql_statement_completed
sqlserver.checkpoint_begin
sqlserver.checkpoint_end
最终测试结果是备份时SQLSERVER会执行多个checkpoint操作
This wasn’t my intended blog post for today, but last night a question came across #SQLHelp on Twitter from Varun (Twitter).

#sqlhelp how many checkpoints are issued during a full backup?

The question was answered by Robert Davis (Blog|Twitter) as:

Just 1, at the very start. RT @1sql: #sqlhelp how many checkpoints are issued during a full backup?

This seemed like a great thing to test out with Extended Events so I ran through the available Events in SQL Server 2008, and the only Event related to Backup is the sqlserver.databases_backup_restore_throughput Event, something which is a topic for another blog post, but that doesn’t matter because we can still do testing of this by using the Events available in Extended Events.  The sqlserver.sql_statement_starting, sqlserver.sql_statement_completed, sqlserver.checkpoint_begin and sqlserver.checkpoint_end Events can be used to test this with appropriate Predicate definitions.

To test this I used a copy of two databases on a development server.  One is a source database and the second is a reporting database.  I also duplicated the ETL process that extracts data from a source database and transforms it into the reporting schema so that I could test this under a workload that would be changing data and should cause checkpoints to occur inside of the reporting database.  Then I queried sys.databases (ok I actually used DB_ID(‘Sample_Reporting’)) to get the database_id for the Sample_Reporting database to use in the Predicate for the sqlserver.checkpoint_begin and sqlserver.checkpoint_end Events.

An XEvent a Day (16 of 31) – How Many Checkpoints are Issued During a Full Backup?   image thumb

Then I opened a new Query Window in SSMS and used that connections session_id in the Predicate for the sqlserver.sql_statement_starting and sqlserver.sql_statement_completed Events in the Event Session.  The result was the following Session definition.

-- Create the Event Session
CREATE EVENT SESSION BackupCheckPoints
ON SERVER
ADD EVENT sqlserver.sql_statement_starting
(    ACTION (sqlserver.database_id, sqlserver.sql_text)
    WHERE (sqlserver.session_id = 113)),
ADD EVENT sqlserver.sql_statement_completed
(    ACTION (sqlserver.database_id, sqlserver.sql_text)
    WHERE (sqlserver.session_id = 113)),
ADD EVENT sqlserver.checkpoint_begin
(    WHERE (database_id= 41)),
ADD EVENT sqlserver.checkpoint_end
(    WHERE (database_id = 41))
ADD TARGET package0.ring_buffer
GO
-- Alter the Session to Start it
ALTER EVENT SESSION BackupCheckpoints
ON SERVER
STATE=START
GO

With the Event Session started, I then started a FULL backup of the Sample Reporting database, followed by starting the ETL processes.  When the FULL backup completed I dropped the Events from the Event Session so that no further Event collection occurred.

-- Drop Events to halt Event collection
ALTER EVENT SESSION BackupCheckPoints
ON SERVER
DROP EVENT sqlserver.sql_statement_starting,
DROP EVENT sqlserver.sql_statement_completed,
DROP EVENT sqlserver.checkpoint_begin,
DROP EVENT sqlserver.checkpoint_end

Now we can query the ring_buffer Target and see what has occurred during the FULL backup of the Sample_Reporting database.

-- Query the XML to get the Target Data
SELECT
    n.value('(event/@name)[1]', 'varchar(50)') AS event_name,
    n.value('(event/@package)[1]', 'varchar(50)') AS package_name,
    DATEADD(hh,
            DATEDIFF(hh, GETUTCDATE(), CURRENT_TIMESTAMP),
            n.value('(event/@timestamp)[1]', 'datetime2')) AS [timestamp],
    ISNULL(n.value('(event/data[@name="database_id"]/value)[1]', 'int'),
            n.value('(event/action[@name="database_id"]/value)[1]', 'int')) AS [database_id],
    n.value('(event/action[@name="sql_text"]/value)[1]', 'nvarchar(max)') AS [sql_text]
FROM
(    SELECT td.query('.') AS n
    FROM
    (
        SELECT CAST(target_data AS XML) AS target_data
        FROM sys.dm_xe_sessions AS s
        JOIN sys.dm_xe_session_targets AS t
            ON t.event_session_address = s.address
        WHERE s.name = 'BackupCheckpoints'
          AND t.target_name = 'ring_buffer'
    ) AS sub
    CROSS APPLY target_data.nodes('RingBufferTarget/event') AS q(td)
) AS tab
GO

An XEvent a Day (16 of 31) – How Many Checkpoints are Issued During a Full Backup?   image thumb

As you can see in the above screenshot, multiple checkpoints can occur during a FULL backup of a database in SQL Server 2008.  According to Paul Randal, “Checkpoints exist for two reasons—to batch up write I/Os to improve performance and to reduce the time required for crash recovery” (http://technet.microsoft.com/en-us/magazine/2009.02.logging.aspx).  Since we are continuing to make changes to the data inside of the system while the FULL backup occurs, there is a continued need for CHECKPOINT’s to occur for the database.

Related Posts

An XEvent a Day (18 of 31) – A Look at Backup Internals and How to Track Backup and Restore Throughput (Part 2)
An XEvent a Day (17 of 31) – A Look at Backup Internals and How to Track Backup and Restore Throughput (Part 1)
An XEvent a Day (28 of 31) – Tracking Page Compression Operations
An XEvent a Day (13 of 31) – The system_health Session
An XEvent a Day (8 of 31) – Targets Week – synchronous_event_counter
A Look at Backup Internals and How to Track Backup and Restore Throughput (Part 1)
查看备份内部并且如何跟踪备份和还原吞吐量(第一部分)
http://www.sqlskills.com/blogs/jonathan/an-xevent-a-day-17-of-31-a-look-at-backup-internals-and-how-to-track-backup-and-restore-throughput-part-1/
bootpage里面没有LSN貌似
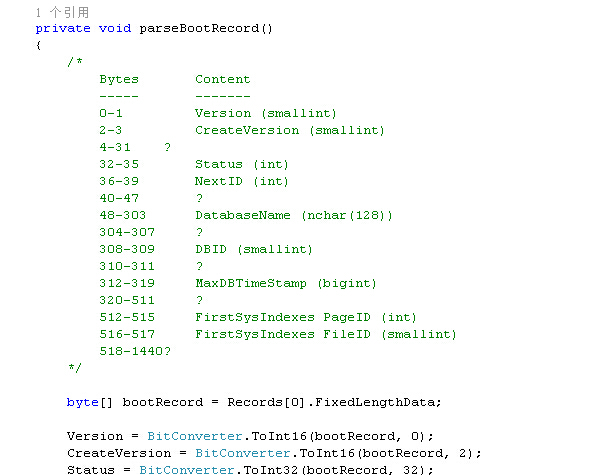
Yesterday I mentioned that there is only one Event in Extended Events that has the word backup in it's name, and that Event is the sqlserver.backup_and_restore_throughput Event.  At first glance this Event looks pretty dull.  It only returns three columns, database_id, count, and increment, and doesn’t really tell us what count and increment mean in the metadata.

-- Get the Event columns
SELECT
    OBJECT_NAME,
    name,
    type_name,
    description
FROM sys.dm_xe_object_columns
WHERE OBJECT_NAME LIKE '%backup%'
  AND column_type = 'data'

An XEvent a Day (17 of 31) – A Look at Backup Internals and How to Track Backup and Restore Throughput (Part 1)   image thumb

I could step you through what I did to look at this Event and figure out the meaning of things, but that would make an already long post longer.  Essentially I created an Event Session with just this Event and used the sqlserver.session_id Predicate to only capture it for a specific session_id that I was going to run a FULL backup from.  The count column is the total number of bytes that have been written to backups and the increment column is the current number of bytes that were written when the Event fired (we’ll see this more in a minute).  This was interesting to see so I started thinking about what kind of information I would want to know about Backups that related to the throughput and two items came to mind almost immediately; read operations from the database, and wait statistics related to the Backup occurring, both of which are available through Extended Events.  I also recalled that there were a few documented Trace Flags associated with Backup and Restore operations that output more verbose information through Trace Prints.  Trace Flag 3004, outputs what operations Backup and Restore are performing (How It Works: What is Restore/Backup Doing?).  Trace Flag 3213, outputs the Backup Buffer configuration information as discussed on the SQLCAT team blog series Tuning the Performance of Backup Compression in SQL Server 2008 and Tuning Backup Compression Part 2.  Trace Flag 3014, outputs additional information about Backup and File operations (How It Works: How does SQL Server Backup and Restore select transfer sizes).  There happens to be a sqlserver.trace_print Event that can capture the trace output as a part of our Event Session.

Using yesterday’s post as a foundation for the Event Session in today’s post, and the same Sample_Reporting Database, lets look at the Event Session that we’ll use to investigate Backups.

-- Create the Event Session
CREATE EVENT SESSION BackupMonitoring
ON SERVER
ADD EVENT sqlserver.sql_statement_starting
(   ACTION (sqlserver.database_id, sqlserver.sql_text)
    WHERE (sqlserver.session_id = 97)),
ADD EVENT sqlserver.sql_statement_completed
(   ACTION (sqlserver.database_id, sqlserver.sql_text)
    WHERE (sqlserver.session_id = 97)),
ADD EVENT sqlserver.databases_backup_restore_throughput
(   WHERE (sqlserver.session_id = 97)),
ADD EVENT sqlos.wait_info
(   ACTION (sqlserver.database_id)
    WHERE (sqlserver.session_id = 97  AND duration > 0)),
ADD EVENT sqlos.wait_info_external
(   ACTION (sqlserver.database_id)
    WHERE (sqlserver.session_id = 97  AND duration > 0)),
ADD EVENT sqlserver.trace_print
(   WHERE (sqlserver.session_id = 97)),
ADD EVENT sqlserver.file_read
(   WHERE (sqlserver.session_id = 97)),
ADD EVENT sqlserver.file_read_completed
(   WHERE (sqlserver.session_id = 97)),
ADD EVENT sqlserver.physical_page_read
(   WHERE (sqlserver.session_id = 97)),
ADD EVENT sqlserver.databases_log_cache_read
(   WHERE (database_id = 41)),
ADD EVENT sqlserver.databases_log_cache_hit
(   WHERE (database_id = 41)),
ADD EVENT sqlserver.databases_log_flush
(   WHERE (database_id = 41)),
ADD EVENT sqlserver.checkpoint_begin
(   WHERE (database_id = 41)),
ADD EVENT sqlserver.checkpoint_end
(   WHERE (database_id = 41))
ADD TARGET package0.asynchronous_file_target(
     SET filename='C:\SQLBlog\BackupMonitoring1.xel',
         metadatafile = 'C:\SQLBlog\BackupMonitoring1.xem')
GO
-- Alter the Session to Start it
ALTER EVENT SESSION BackupMonitoring
ON SERVER
STATE=START
GO

There is a lot of information being collected in this Event Session.  We are going to get the sql_statement_starting and completed Events, the backup_restore_throughput Event, wait_info Event for SQLOS waits inside of SQL Server and the wait_info_external Event for preemptive waits outside of SQL Server, the trace_print Event to capture our Trace Flag outputs, the file_read, file_read_completed, and physical_page_read Events to capture read operations from the session_id performing the Backup, the database_log_cache_read, database_log_cache_hit, and database_log_flush Events to track transaction log cache operations during the Backup, and the checkpoint_begin and checkpoint_end Events to track checkpoint occurrence during the backup and how they might impact throughput.  If you notice, some of the Events are Predicated on the session_id, while others are predicated on the database_id, and this is very intentional in the definition of this Event Session.  Some Events do not fire in the context of a specific database_id, and some Events do not fire in the context of a specific session_id, and some will fire for both.  Where the database_id is a practical Predicate for the Event, and it is carried in the Events base payload, it is a natural item to use for a Predicate.  Restricting Events to a specific database_id or session_id will prevent Event capture from other operations occurring on the SQL Server.

With our Event Session defined and started, we can now run a Backup of the database and see what we capture.  I am going to show two different Backup configurations in this post, based on the information contained in the SQLCAT series on tuning Backup Performance in SQL Server 2008.  The first one uses a default configuration for the BUFFERCOUNT and MAXTRANSFERSIZE Backup options, but also uses Database Compression since it is available to minimize he backup file size, and maximize the throughput of the backup operation.

BACKUP DATABASE [Sample_Reporting]
TO  DISK = N'B:\SQLData\MSSQL10.MSSQLSERVER\MSSQL\Backup\Sample_Reporting1.bak'
WITH NOFORMAT,
    NOINIT,
    NAME = N'Sample_Reporting-Full Database Backup Number 1',
    SKIP,
    NOREWIND,
    NOUNLOAD,
    COMPRESSION,
    STATS = 5
GO

On this server, the backups are writing to a dedicated RAID1 disk array using two 146GB 15K RPM SAS drives.  When the backup completes we can begin our analysis of the Events captured by our Event Session.  To make it possible to perform various types of analysis of the data contained inside of the asynchronous_file_target, I am going to read the Raw XML Event data into a temporary table, and then shred the XML into a second temporary table, making it possible to just query the shredded data.

DROP TABLE #EventData
DROP TABLE #TestResults

-- Create intermediate temp table for raw event data
CREATE TABLE #EventData
(Rowid INT IDENTITY PRIMARY KEY, event_data XML)

-- Create final results table for parsed event data
CREATE TABLE #TestResults
(Rowid INT PRIMARY KEY, event_name VARCHAR(50), package_name VARCHAR(50),
[timestamp] datetime2, database_id INT, trace_print NVARCHAR(4000),
[count] bigint, increment bigint, wait_type NVARCHAR(100), opcode NVARCHAR(10),
duration bigint, max_duration bigint, total_duration bigint, signal_duration bigint,
completed_count bigint, source_database_id INT, [object_id] INT, object_type INT,
[state] NVARCHAR(50), offset bigint, offset_end INT, nest_level INT, cpu INT,
reads bigint, writes bigint, mode NVARCHAR(50), FILE_ID INT, page_id INT,
file_group_id INT, sql_text NVARCHAR(4000))

-- Read the file data into intermediate temp table
INSERT INTO #EventData (event_data)
SELECT
    CAST(event_data AS XML) AS event_data
FROM sys.fn_xe_file_target_read_file('C:\SQLBlog\BackupMonitoring1*.xel', 'C:\SQLBlog\BackupMonitoring1*xem', NULL, NULL)

-- Query the Event data from the Target.
INSERT INTO #TestResults
(Rowid, event_name, package_name, [timestamp], database_id, trace_print,
[count], increment, wait_type, opcode, duration, max_duration, total_duration,
signal_duration, completed_count, source_database_id, [object_id], object_type,
[state], offset, offset_end, nest_level, cpu,  reads, writes, mode, FILE_ID,
page_id, file_group_id, sql_text)

SELECT
    RowID,
    event_data.value('(event/@name)[1]', 'varchar(50)') AS event_name,
    event_data.value('(event/@package)[1]', 'varchar(50)') AS package_name,
    DATEADD(hh,
            DATEDIFF(hh, GETUTCDATE(), CURRENT_TIMESTAMP),
            event_data.value('(event/@timestamp)[1]', 'datetime2')) AS [timestamp],
    COALESCE(event_data.value('(event/data[@name="database_id"]/value)[1]', 'int'),
                event_data.value('(event/action[@name="database_id"]/value)[1]', 'int')) AS database_id,
    event_data.value('(event/data[@name="message"]/value)[1]', 'nvarchar(4000)') AS trace_print,
    event_data.value('(event/data[@name="count"]/value)[1]', 'bigint')  AS [count],
    event_data.value('(event/data[@name="increment"]/value)[1]', 'bigint')  AS [increment],
    event_data.value('(event/data[@name="wait_type"]/text)[1]', 'nvarchar(100)') AS wait_type,
    event_data.value('(event/data[@name="opcode"]/text)[1]', 'nvarchar(10)') AS opcode,
    event_data.value('(event/data[@name="duration"]/value)[1]', 'bigint')  AS duration,
    event_data.value('(event/data[@name="max_duration"]/value)[1]', 'bigint')  AS max_duration,
    event_data.value('(event/data[@name="total_duration"]/value)[1]', 'bigint')  AS total_duration,
    event_data.value('(event/data[@name="signal_duration"]/value)[1]', 'bigint')  AS signal_duration,
    event_data.value('(event/data[@name="completed_count"]/value)[1]', 'bigint')  AS completed_count,
    event_data.value('(event/data[@name="source_database_id"]/value)[1]', 'int')  AS source_database_id,
    event_data.value('(event/data[@name="object_id"]/value)[1]', 'int')  AS OBJECT_ID,
    event_data.value('(event/data[@name="object_type"]/value)[1]', 'int')  AS object_type,
    event_data.value('(event/data[@name="state"]/text)[1]', 'nvarchar(50)') AS state,
    event_data.value('(event/data[@name="offset"]/value)[1]', 'bigint')  AS offset,
    event_data.value('(event/data[@name="offset_end"]/value)[1]', 'int')  AS offset_end,
    event_data.value('(event/data[@name="nest_level"]/value)[1]', 'int')  AS nest_level,
    event_data.value('(event/data[@name="cpu"]/value)[1]', 'int')  AS cpu,
    event_data.value('(event/data[@name="reads"]/value)[1]', 'bigint')  AS reads,
    event_data.value('(event/data[@name="writes"]/value)[1]', 'bigint')  AS writes,
    event_data.value('(event/data[@name="mode"]/text)[1]', 'nvarchar(50)') AS mmode,
    event_data.value('(event/data[@name="file_id"]/value)[1]', 'int')  AS FILE_ID,
    event_data.value('(event/data[@name="page_id"]/value)[1]', 'int')  AS page_id,
    event_data.value('(event/data[@name="file_group_id"]/value)[1]', 'int')  AS file_group_id,
    event_data.value('(event/action[@name="sql_text"]/value)[1]', 'nvarchar(4000)') AS sql_text
FROM #EventData
ORDER BY Rowid

-- Look at the Results.
SELECT
    Rowid,
    event_name,
    database_id,
    trace_print,
    [count],
    increment,
    wait_type,
    duration,
    signal_duration,
    cpu,
    reads,
    writes,
    mode,
    FILE_ID,
    page_id,
    file_group_id,
    sql_text
FROM #TestResults
ORDER BY Rowid

In the above query, I am extracting all of the data elements from the Event data, even though in the final query I am not using all of the data.  I did this to have a complete example of how to shred the XML, and because we are storing it in a temp table, we may find that we want to come back and look at specific data elements that were excluded in the initial look at the results.  From our results we can begin to understand how Backup Operations work inside of SQL Server.

An XEvent a Day (17 of 31) – A Look at Backup Internals and How to Track Backup and Restore Throughput (Part 1)   image thumb

Here we can see the statement starting to execute, and the first output from the trace_print Event showing that the backup of the database was starting, along with the external waits associated with performing file operations to create a Backup file for the database.

An XEvent a Day (17 of 31) – A Look at Backup Internals and How to Track Backup and Restore Throughput (Part 1)   image thumb

Here the newly created Backup file is opened an 1K of write occur to the file before it becomes ready for the Backup.

An XEvent a Day (17 of 31) – A Look at Backup Internals and How to Track Backup and Restore Throughput (Part 1)   image thumb

Here we can see two operations being performed.  In the red outlined box, since we are doing a full Backup of the database, the differential bitmaps, pages that track which extents in a GAM interval have been modified since the last full or differential backup (Inside the Storage Engine: Anatomy of an extent), are cleared.  In the blue outlined box, we see the checkpoint triggered by the Backup operation begin, and in the four highlighted boxes in grey, we see two physical_page_reads occur for the database, one from the transaction log, and one from the primary data file.  These are the pages that are written to when Checkpoint occurs in the database.  The file_id 2 page_id 0 page is where the Log Sequence Number is written to the log file, and file_id 1 page_id 9 is the database boot page, where the LSN is also written to at checkpoint (Checkpoints and the Active Portion of the Log).  We also see the wait_info event for the PAGEIOLATCH_UP wait to update of this information.

An XEvent a Day (17 of 31) – A Look at Backup Internals and How to Track Backup and Restore Throughput (Part 1)   image thumb

Next the allocation bitmaps for the database are scanned and an estimate of the work is performed (red box) before writing 5K of metadata into the backup file.

An XEvent a Day (17 of 31) – A Look at Backup Internals and How to Track Backup and Restore Throughput (Part 1)   image thumb

At this point the Backup process is ready to begin copying data to the Backup file.  Since this particular database only has 1 data file, only one reader is assigned to the backup (Optimising Backup & Restore Performance in SQL Server).  When the Backup starts on the file, an additional 1024 bytes (1K of information is written to the Backup file and the file read operations against the database data file(s) commences.

An XEvent a Day (17 of 31) – A Look at Backup Internals and How to Track Backup and Restore Throughput (Part 1)   image thumb

As the backup of the data file data begins, we see a change in the size of the increment being written to the Backup file, and now we have 1MB segments of data being written to the file.

An XEvent a Day (17 of 31) – A Look at Backup Internals and How to Track Backup and Restore Throughput (Part 1)   image thumb
We can also see that multiple 1MB segments are written within milliseconds of each other.  Now I could spend a lot of time running through the entire set of Events showing the same thing, but with 187,698 Events for a 110 second Backup, that would take forever.  Instead I am going to skip over all the interim file reads and Backup file writes and get to the end of the data file section.

An XEvent a Day (17 of 31) – A Look at Backup Internals and How to Track Backup and Restore Throughput (Part 1)   image thumb

Highlighted in black above, we see the completion of the first data file, followed by a trace_print event, in red, Padding MSDA with 196608 bytes (192K of space), and then the trace_print event, in blue, showing the completion of all Database files, which is also the beginning of the Transaction log portion of the backup.

An XEvent a Day (17 of 31) – A Look at Backup Internals and How to Track Backup and Restore Throughput (Part 1)   image thumb

Here we can see that the size of the log information being backed up, highlighted in black, is significantly different from the data file information which is to be expected since log records are very different from data records in composition.  When the log files done trace_print Event in red, and the trailing configuration writres in blue and the trace_print Event in orange marking the completion of the trailing configuration.

An XEvent a Day (17 of 31) – A Look at Backup Internals and How to Track Backup and Restore Throughput (Part 1)   image thumb

I don’t know what MBC done means, and I couldn’t find it online, but it completed here.  I think it might stand for MaxBufferCount, and the above line shows that all of the buffers have been written out for the backup. (Don’t quote me on that I am just taking a SWAG there!)

An XEvent a Day (17 of 31) – A Look at Backup Internals and How to Track Backup and Restore Throughput (Part 1)   image thumb

After the MBC is done, the backup history records are written into MSDB.

An XEvent a Day (17 of 31) – A Look at Backup Internals and How to Track Backup and Restore Throughput (Part 1)   image thumb

And finally the backup completes.  So far all that we’ve done is look at all of the information that we can get, and there is a lot of it, but unless we can do something actionable with all this information, there is no real point in gathering it.  I originally intended to only cover one post on this subject but its become quite large, so I am splitting it into two posts and in tomorrow’s post we’ll look at how we can use the information captured in today’s post to validate whether or not changes to our backup process have a positive or negative impact on backup times and throughput.
A Look at Backup Internals and How to Track Backup and Restore Throughput (Part 2)
查看备份内部并且如何跟踪备份和还原吞吐量(第二部分)
http://www.sqlskills.com/blogs/jonathan/an-xevent-a-day-18-of-31-a-look-at-backup-internals-and-how-to-track-backup-and-restore-throughput-part-2/
buffercount的计算公式:(NumberofBackupDevices * GetSuggestedIoDepth) + NumberofBackupDevices + (2*DatabaseDeviceCount)
specifically memory outside of the buffer pool from Virtual Address Space.
备份使用的内存是非bufferpool 内存从VAS里面
在32位操作系统里有可能会导致OOM,内存不足
备份所用内存: Total buffer space:1024MB
In yesterday’s blog post A Look at Backup Internals and How to Track Backup and Restore Throughput (Part 1), we looked at what happens when we Backup a database in SQL Server.  Today, we are going to use the information we captured to perform some analysis of the Backup information in an attempt to find ways to decrease the time it takes to backup a database.  When I began reviewing the data from the Backup in yesterdays post, I realized that I had made a mistake in the process and left Trace Flag 3213 off, which left some information that we’ll need out of the results, the Backup Buffer Configuration information.  For this post I turned Trace Flag 3213 on, and reran the Backup from yesterday, so the results may differ slightly but the same Backup command was used for the tests.

An XEvent a Day (18 of 31) – A Look at Backup Internals and How to Track Backup and Restore Throughput (Part 2)   image thumb 165082CD
The Backup Buffer Configuration information tells us how many Buffers were allocated, and what the Max Transfer Size being used is.  In the screenshot above, this information is outlined in the red box.  The default Buffer Count is determined by SQL Server when the BUFFERCOUNT option is not specified in the BACKUP DATABASE command.  The calculation used is:

(NumberofBackupDevices * GetSuggestedIoDepth) + NumberofBackupDevices + (2*DatabaseDeviceCount)

This is covered in detail on Amit Banerjee’s blog post, Incorrect BufferCount data transfer option can lead to OOM condition.  For the Backup in yesterday’s post, and the one that will be the baseline for today’s post, the BUFFERCOUNT option was not specified, and the Backup, as shown above, used 7 Buffers and the default MaxTransferSize of 1MB for the backup.  If we look at the aggregated Event and wait_type information contained in the Event Session for the Backup we can begin to see what types of Backup bottlenecks we might have in the system.

SELECT
    ISNULL(wait_type, event_name) AS Operation,
    SUM(duration) AS duration,
    SUM(signal_duration) AS signal_duration,
    COUNT(*) AS occurences
FROM #TestResults
WHERE (duration IS NOT NULL OR signal_duration IS NOT NULL)
  AND ISNULL(wait_type, event_name) IN
        ('BACKUPBUFFER', 'BACKUPIO')
GROUP BY ISNULL(wait_type, event_name) An XEvent a Day (18 of 31) – A Look at Backup Internals and How to Track Backup and Restore Throughput (Part 2)   image thumb 48D3E03F

Looking at this information, we have a large number of BACKUPBUFFER waits occurring during the backup of the database and this may be a potential tuning opportunity to improve the performance of our database Backups.  To test this, we can change our Backup Script to include a 4GB MAXTRANSFERSIZE and a BUFFERCOUNT of 16.  I also chose to change the filenames in the Extended Events Session to simplify working with the Target Data for each test individually.  It is possible to specify the exact filename and metadatafile names when you read from the Target, but that requires more work than is needed in my opinion.  For the sake of brevity I am not going to repeat all of the Extended Events information in this blog post, but instead show the outcome of running various configurations of BUFFERCOUNT against a test server.

Test Number    Backup File Count    Buffer Count    Max Transfer Size    Backup Time (s)    BACKUPBUFFER (wait ms)    BACKUPIO (wait ms)    BACKUPBUFFER (wait count)    BACKUPIO (wait count)
1    1    7    1024    122.5    159471    62587    81616    22815
2    1    16    4096    105.2    90963    69091    14513    7982
3    1    32    4096    99.5    75236    88634    12298    8679
4    1    128    4096    95.9    70173    63435    8292    4679
5    1    256    4096    95.9    50988    48942    1538    1135
6    2    128    4096    96    152323    63800    12416    4925
7    2    256    4096    96.4    109565    46953    3067    1195
The same Event Session was used to gather the above metrics in seven repetitive tests.  The test server is a Dell R710 dual quad core system with 24GB RAM and HT enabled.  It has eight internal 15K RPM 146GB SAS drives that are configured into 2 RAID 1 drive pairs and a single 4 disk RAID 5 array.  One of the RAID 1 drive pairs was dedicated to the OS, and SQL Binaries.  The other was used for writing the backups, and the database data/log/tempdb files were placed on the RAID 5 array.  This isn’t the ideal configuration for a setup, but its what I had available at the moment to work with, and is similar to some of the configurations I’ve seen in the real world as well.  The Backups were segregated to a dedicated disk that was RAID 1 for this test to avoid RAID 5 write penalties, and to maximize the backup write throughput by isolating it from any other operations.

The above results can be interpreted a number of different ways.  As the BUFFERCOUNT increases the backup time decreases, and so does the amount of time spent waiting on Backup Buffers.  However, there is a tradeoff that is being made in memory consumption; specifically memory outside of the buffer pool from Virtual Address Space.  On 32 bit servers this can lead to Out of Memory exceptions, the topic of Amit’s blog post referenced previously in this blog post.  Test Number 5, with 256 buffers and a 4MB transfer size will use 1GB of memory as shown in the Backup Buffer Configuration Information.

An XEvent a Day (18 of 31) – A Look at Backup Internals and How to Track Backup and Restore Throughput (Part 2)   image thumb 61637D8F
On the test server used for this testing, the bottleneck is the disks that the backup file is being written to and further improvements in performance will require additional IO to accomplish.  The test database has 30GB of data in it, and with backup compression, the backup size is 7.8GB in size on disk.  For a full backup to take just over a minute and a half for this database is not that bad, but it is going to local disks and there is no safeguard for the data in the event of a catastrophic loss of the physical server entirely unless the data gets copied to another location in the network after a local backup occurs.
Using Customizable Fields
http://www.sqlskills.com/blogs/jonathan/an-xevent-a-day-19-of-31-using-customizable-fields/
使用自定义字段
Today’s post will be somewhat short, but we’ll look at Customizable Fields on Events in Extended Events and how they are used to collect additional information.  Customizable Fields generally represent information of potential interest that may be expensive to collect, and is therefore made available for collection if specified by the Event Session.  In SQL Server 2008 and 2008 R2, there are 50 Events that have customizable columns in their payload.  In SQL Server Denali CTP1, there are 124 Events that have customizable columns in their payload. The customizable columns and Events that have them can be found with the following query.

SELECT
    p.name AS package_name,
    o.name AS event_name,
    oc.name AS column_name,
    oc.column_type,
    oc.type_name,
    oc.description
FROM sys.dm_xe_packages p
JOIN sys.dm_xe_objects o
    ON p.guid = o.package_guid
JOIN sys.dm_xe_object_columns oc
    ON o.name = oc.object_name
        AND o.package_guid = oc.object_package_guid
WHERE ((p.capabilities is null or p.capabilities & 1 = 0)
  AND (o.capabilities is null or o.capabilities & 1 = 0)
  AND (oc.capabilities is null or oc.capabilities & 1 = 0))
  AND o.object_type = 'event'
  AND oc.column_type = 'customizable'
If we look at a specific Event containing a customizable column, in this case the sqlserver.file_read_completed Event, we will see that there is a customizable column as well as a data column for the data collected by the customizable column.

SELECT
    p.name AS package_name,
    o.name AS event_name,
    oc.column_id,
    oc.name AS column_name,
    oc.column_type,
    oc.type_name,
    oc.description
FROM sys.dm_xe_packages p
JOIN sys.dm_xe_objects o
    ON p.guid = o.package_guid
JOIN sys.dm_xe_object_columns oc
    ON o.name = oc.object_name
        AND o.package_guid = oc.object_package_guid
WHERE ((p.capabilities is null or p.capabilities & 1 = 0)
  AND (o.capabilities is null or o.capabilities & 1 = 0)
  AND (oc.capabilities is null or oc.capabilities & 1 = 0))
  AND o.object_type = 'event'
  AND o.name = 'file_read_completed'
  AND oc.column_type <> 'readonly'
ORDER BY oc.column_type, oc.column_id
An XEvent a Day (19 of 31) – Using Customizable Fields   image thumb

In the red box are the customizable columns, and the blue box has the associated data columns to the customizable columns.  The data columns will exist in the Event data from the Event firing, but they will only have a value in the Event data if the customizable column is set to collect the information.

CREATE EVENT SESSION CustomizableColumnDemo
ON SERVER
ADD EVENT sqlserver.file_read_completed
(
    WHERE (database_id = 4)
)
ADD TARGET package0.ring_buffer
GO
ALTER EVENT SESSION CustomizableColumnDemo
ON SERVER
STATE=START
GO
DBCC DROPCLEANBUFFERS
GO
SELECT TOP 10 * FROM msdb.dbo.backupset
GO
If we query the Target data for the above Event, we’ll see that the path and io_data columns are included in the Event XML, but there is no value in the XML nodes.

SELECT CAST(target_data AS XML) as target_data
FROM sys.dm_xe_sessions AS s
JOIN sys.dm_xe_session_targets AS t
    ON s.address = t.event_session_address
WHERE s.name = 'CustomizableColumnDemo'
  AND t.target_name = 'ring_buffer'
<event name="file_read_completed" package="sqlserver" id="83" version="1" timestamp="2010-12-20T03:14:20.393Z">
  <data name="mode">
    <type name="file_io_mode" package="sqlserver" />
    <value>0</value>
    <text>Contiguous</text>
  </data>
  <data name="duration">
    <type name="uint64" package="package0" />
    <value>0</value>
    <text />
  </data>
  <data name="file_handle">
    <type name="ulong_ptr" package="package0" />
    <value>0x0000000000000b38</value>
    <text />
  </data>
  <data name="offset">
    <type name="uint64" package="package0" />
    <value>14352384</value>
    <text />
  </data>
  <data name="database_id">
    <type name="uint16" package="package0" />
    <value>4</value>
    <text />
  </data>
  <data name="file_id">
    <type name="uint16" package="package0" />
    <value>1</value>
    <text />
  </data>
  <data name="file_group_id">
    <type name="uint16" package="package0" />
    <value>1</value>
    <text />
  </data>
  <data name="path">
    <type name="unicode_string" package="package0" />
    <value />
    <text />
  </data>
  <data name="io_data">
    <type name="binary_data" package="package0" />
    <value />
    <text />
  </data>
</event>
To set the customizable column to collect the data, in the ADD EVENT section of the CREATE EVENT SESSION or ALTER EVENT SESSION DDL command, the SET option is used to turn data collection on for the column.

DROP EVENT SESSION CustomizableColumnDemo
ON SERVER
GO
CREATE EVENT SESSION CustomizableColumnDemo
ON SERVER
ADD EVENT sqlserver.file_read_completed
(
    SET collect_path = 1
    WHERE(database_id = 4)
)
ADD TARGET package0.ring_buffer
GO
ALTER EVENT SESSION CustomizableColumnDemo
ON SERVER
STATE=START
GO
DBCC DROPCLEANBUFFERS
GO
SELECT TOP 10 * FROM msdb.dbo.backupset
GO
ALTER EVENT SESSION CustomizableColumnDemo
ON SERVER
DROP EVENT sqlserver.file_read_completed
GO
Notice that the SET option does not use parenthesis, they are not allowed in the DDL definition.  By setting the collect_path customizable column to 1 the Event XML now contains the path to the data file that was read.

-- Query the XML to get the Target Data
SELECT
    n.value('(event/@name)[1]', 'varchar(50)') AS event_name,
    n.value('(event/@package)[1]', 'varchar(50)') AS package_name,
    DATEADD(hh,
            DATEDIFF(hh, GETUTCDATE(), CURRENT_TIMESTAMP),
            n.value('(event/@timestamp)[1]', 'datetime2')) AS [timestamp],
    ISNULL(n.value('(event/data[@name="database_id"]/value)[1]', 'int'),
            n.value('(event/action[@name="database_id"]/value)[1]', 'int')) as [database_id],
    n.value('(event/data[@name="mode"]/value)[1]', 'nvarchar(50)') as [mode],
    n.value('(event/data[@name="duration"]/value)[1]', 'bigint') as [duration],
    n.value('(event/data[@name="file_handle"]/value)[1]', 'nvarchar(50)') as [file_handle],
    n.value('(event/data[@name="offset"]/value)[1]', 'int') as [offset],
    n.value('(event/data[@name="file_id"]/value)[1]', 'int') as [file_id],
    n.value('(event/data[@name="path"]/value)[1]', 'nvarchar(250)') as [path],
    n.value('(event/data[@name="id_data"]/value)[1]', 'nvarchar(max)') as [io_data]
FROM
(    SELECT td.query('.') as n
    FROM
    (
        SELECT CAST(target_data AS XML) as target_data
        FROM sys.dm_xe_sessions AS s
        JOIN sys.dm_xe_session_targets AS t
            ON s.address = t.event_session_address
        WHERE s.name = 'CustomizableColumnDemo'
          AND t.target_name = 'ring_buffer'
    ) AS sub
    CROSS APPLY target_data.nodes('RingBufferTarget/event') AS q(td)
) as tab
GO
An XEvent a Day (19 of 31) – Using Customizable Fields   image thumb

The increase in the number of Events with customizable columns in Denali CTP1 is, in my own opinion, a great step in the right direction for Extended Events.  The use of customizable columns to add data into the Event payload extends the flexibility of Extended Events by providing a mechanism to gather additional data related to Events that is specific to the Event and not globally available like Actions.
Mapping Extended Events to SQL Trace
http://www.sqlskills.com/blogs/jonathan/an-xevent-a-day-16-of-31-how-many-checkpoints-are-issued-during-a-full-backup/
扩展事件和SQL Trace的映射
--sql2012新增的扩展事件和sql trace映射视图
 SELECT * FROM master.sys.trace_xe_event_map
 SELECT * FROM   master.[sys].trace_xe_action_map
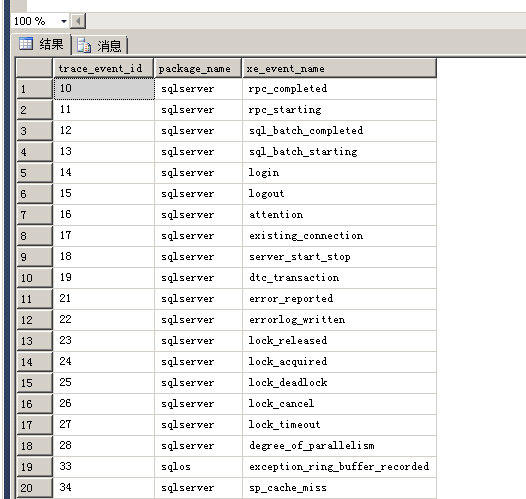
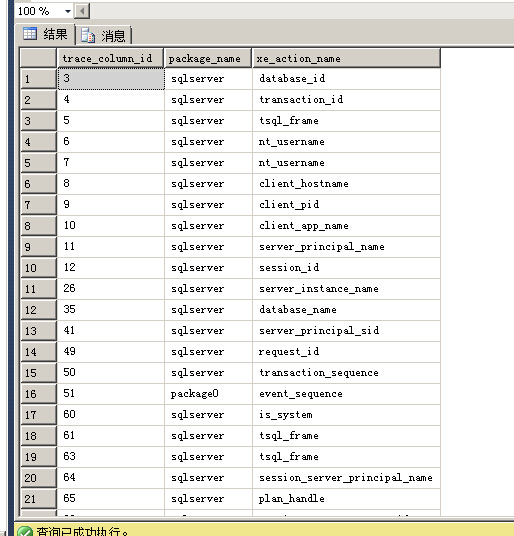
One of the biggest problems that I had with getting into Extended Events was mapping the Events available in Extended Events to the Events that I knew from SQL Trace.  With so many Events to choose from in Extended Events, and a different organization of the Events, it is really easy to get lost when trying to find things.  Add to this the fact that Event names don’t match up to Trace Event names in SQL Server 2008 and 2008 R2, and not all of the Events from Trace are implemented in SQL Server 2008 and 2008 R2, and it gets really confusing really fast.  For my presentation this year at SQLBits 7, I sat down with Excel and mapped out the Events that exist in Extended Events to their corresponding SQL Trace Event, and two of the slides in my deck were tables of these mappings.

TraceCategory    TraceEvent    PackageName    XEEventName
Deprecation    Deprecation Announcement    sqlserver    deprecation_announcement
Deprecation    Deprecation Final Support    sqlserver    deprecation_final_support
Errors and Warnings    ErrorLog    sqlserver    errorlog_written
Errors and Warnings    EventLog    sqlserver    error_reported
Errors and Warnings    Exception    sqlos    exception_ring_buffer_recorded
Errors and Warnings    User Error Message    sqlserver    error_reported
Full text    FT:Crawl Aborted    sqlserver    error_reported
Locks    Deadlock graph    sqlserver    xml_deadlock_report
Locks    Lock:Acquired    sqlserver    lock_acquired
Locks    Lock:Deadlock    sqlserver    lock_deadlock
Locks    Lock:Released    sqlserver    lock_released
Locks    Lock:Timeout    sqlserver    locks_lock_timeouts
Locks    Lock:Timeout (timeout > 0)    sqlserver    locks_lock_timeout_greater_than_0
Stored Procedures    RPC Output Parameter    sqlserver    rpc_completed
Stored Procedures    RPC:Completed    sqlserver    rpc_completed
Stored Procedures    RPC:Starting    sqlserver    rpc_starting
Stored Procedures    SP:Completed    sqlserver    module_end
Stored Procedures    SP:Recompile    sqlserver    sp_statement_starting
Stored Procedures    SP:Starting    sqlserver    module_start
Stored Procedures    SP:StmtCompleted    sqlserver    sp_statement_completed
Stored Procedures    SP:StmtStarting    sqlserver    sp_statement_starting
TSQL    SQL:StmtCompleted    sqlserver    sql_statement_completed
TSQL    SQL:StmtRecompile    sqlserver    sql_statement_starting
TSQL    SQL:StmtStarting    sqlserver    sql_statement_starting
User configurable    UserConfigurable    sqlserver    user_settable
I have a script that creates a view for these in my administrative database, that is a part of my SQL Server 2008 configuration script for my environment. That script is attached to this blog post for use in your own environment.

In SQL Server Denali CTP1, a table has been added to the master database named dbo.trace_xe_event_map that provides a static mapping of each Trace Event to its corresponding Extended Events Event (This table should be in the sys schema to maintain uniformity in the product and I filed a Connect Feedback to move this that needs votes to have this changed).  Mike Wachal blogged about this table and how it and its partner table dbo.trace_xe_action_map can be used to migrate from SQL Trace to Extended Events in his blog post Migrating from SQL Trace to Extended Events.  He also includes a really cool SQLCLR Stored Procedure that will perform the conversion for you automagically.
The Future – Tracking Blocking in Denali
http://www.sqlskills.com/blogs/jonathan/an-xevent-a-day-21-of-31-the-future-tracking-blocking-in-denali/
未来 跟踪 阻塞在sql2012
排查阻塞问题,先设置阻塞阀值
One of my favorite features that was added to SQL Server 2005 has been the Blocked Process Report trace event which collects an XML report whenever a process is blocked inside of the database engine longer than the user configurable threshold.  I wrote an article about this feature on SQL Server Central  two years ago titled Using the Blocked Process Report in SQL Server 2005/2008.  One of the aspects of this feature is that it requires that you either have a SQL Trace running that captures the event, or you configure Event Notifications on the server to capture the event information in a Service Broker Queue, neither of which is overly difficult to accomplish.  In SQL Server Denali CTP1, there is a new Extended Event, sqlserver.blocked_process_report, that makes this even easier to use.  We can now create an Event Session that exists in our SQL Server and is waiting to be started to capture blocked process information as needed.  However, we still have to set the ‘blocked process threshold’ sp_configure option to set the threshold at which blocked process report information is generated by Database Engine, firing the Event in our Event Session.

CREATE EVENT SESSION MonitorBlocking
ON SERVER
ADD EVENT sqlserver.blocked_process_report
ADD TARGET package0.ring_buffer(SET MAX_MEMORY=2048)
WITH (MAX_DISPATCH_LATENCY = 5SECONDS)
GO
ALTER EVENT SESSION MonitorBlocking
ON SERVER
STATE=START
GO
EXECUTE sp_configure 'show advanced options', 1
GO
RECONFIGURE
GO
EXECUTE sp_configure 'blocked process threshold', 15
GO
RECONFIGURE
GO
EXECUTE sp_configure 'show advanced options', 0
GO
RECONFIGURE
GO
To test this Event Session, we can open two New Query Windows in SSMS and connect them to our database engine.  Then in one window run the following code:

USE [tempdb]
GO
CREATE TABLE t1 (RowID int identity primary key)
GO
BEGIN TRANSACTION
INSERT INTO t1 DEFAULT VALUES
WAITFOR DELAY '00:00:30'
COMMIT
Then in the other window run the following code:

USE [tempdb]
GO
SELECT * FROM t1
The first query will block the execution of the second query until it completes, generating our blocked process report in the ring_buffer Target for our Event Session.  To get the information from the ring_buffer target, we can run a quick XQuery to parse the Target (at this point in the series, you should be an XQuery pro):

-- Query the XML to get the Target Data
SELECT
    n.value('(event/@name)[1]', 'varchar(50)') AS event_name,
    n.value('(event/@package)[1]', 'varchar(50)') AS package_name,
    DATEADD(hh,
            DATEDIFF(hh, GETUTCDATE(), CURRENT_TIMESTAMP),
            n.value('(event/@timestamp)[1]', 'datetime2')) AS [timestamp],
    ISNULL(n.value('(event/data[@name="database_id"]/value)[1]', 'int'),
            n.value('(event/action[@name="database_id"]/value)[1]', 'int')) as [database_id],
    n.value('(event/data[@name="database_name"]/value)[1]', 'nvarchar(128)') as [database_name],
    n.value('(event/data[@name="object_id"]/value)[1]', 'int') as [object_id],
    n.value('(event/data[@name="index_id"]/value)[1]', 'int') as [index_id],
    CAST(n.value('(event/data[@name="duration"]/value)[1]', 'bigint')/1000000.0 AS decimal(6,2)) as [duration_seconds],
    n.value('(event/data[@name="lock_mode"]/text)[1]', 'nvarchar(10)') as [file_handle],
    n.value('(event/data[@name="transaction_id"]/value)[1]', 'bigint') as [transaction_id],
    n.value('(event/data[@name="resource_owner_type"]/text)[1]', 'nvarchar(10)') as [resource_owner_type],
    CAST(n.value('(event/data[@name="blocked_process"]/value)[1]', 'nvarchar(max)') as XML) as [blocked_process_report]
FROM
(    SELECT td.query('.') as n
    FROM
    (
        SELECT CAST(target_data AS XML) as target_data
        FROM sys.dm_xe_sessions AS s
        JOIN sys.dm_xe_session_targets AS t
            ON s.address = t.event_session_address
        WHERE s.name = 'MonitorBlocking'
          AND t.target_name = 'ring_buffer'
    ) AS sub
    CROSS APPLY target_data.nodes('RingBufferTarget/event') AS q(td)
) as tab
GO
An XEvent a Day (21 of 31)   The Future   Tracking Blocking in Denali   image thumb

The output of the Event in Extended Events contains some additional information to the blocked process report in XML format including the database_id, object_id, index_id, duration, lock_mode, transaction_id, and resource_owner_type for the blocking resource.  Clicking on the blocked process report XML will open it up in Management Studio as an XML document allowing detailed analysis of the blocking to be performed.

<blocked-process-report>
  <blocked-process>
    <process id="process2eb8bda8" taskpriority="0" logused="0" waitresource="KEY: 2:2666130980878942208 (61a06abd401c)"
             waittime="25480" ownerId="12748" transactionname="SELECT" lasttranstarted="2010-12-21T18:19:03.263"
             XDES="0x2dfb9c10" lockMode="S" schedulerid="1" kpid="2484" status="suspended" spid="60" sbid="0" ecid="0"
             priority="0" trancount="0" lastbatchstarted="2010-12-21T18:19:03.263"
             lastbatchcompleted="2010-12-21T18:19:03.263" clientapp="Microsoft SQL Server Management Studio - Query"
             hostname="WIN-5B9V8JPLP3H" hostpid="2708" loginname="WIN-5B9V8JPLP3H\Administrator"
             isolationlevel="read committed (2)" xactid="12748" currentdb="2" lockTimeout="4294967295"
             clientoption1="671090784" clientoption2="390200">
      <executionStack>
        <frame line="1" sqlhandle="0x02000000d9de7b2f4f3a78e40f100bc02a84efbb9f01a84d" />
      </executionStack>
      <inputbuf>
SELECT * FROM t1   </inputbuf>
    </process>
  </blocked-process>
  <blocking-process>
    <process status="suspended" waittime="27430" spid="57" sbid="0" ecid="0" priority="0" trancount="1"
             lastbatchstarted="2010-12-21T18:19:01.437" lastbatchcompleted="2010-12-21T18:13:25.637"
             clientapp="Microsoft SQL Server Management Studio - Query" hostname="WIN-5B9V8JPLP3H"
             hostpid="2708" loginname="WIN-5B9V8JPLP3H\Administrator" isolationlevel="read committed (2)"
             xactid="12733" currentdb="2" lockTimeout="4294967295" clientoption1="671090784" clientoption2="390200">
      <executionStack>
        <frame line="3" stmtstart="100" stmtend="150" sqlhandle="0x020000005a74b3030117e049389a93b2ce5bfb48e272f938" />
      </executionStack>
      <inputbuf>
BEGIN TRANSACTION
INSERT INTO t1 DEFAULT VALUES
WAITFOR DELAY '00:00:30'
COMMIT   </inputbuf>
    </process>
  </blocking-process>
</blocked-process-report>
The output of the blocked process report in Extended Events is the same as the blocked process report from SQL Trace and Event Notifications.  This is only a new mechanism of collecting this information, and when Denali releases RTM, this will be an Event Session that I install on my Denali based servers as a part of my configuration scripts, having it ready to activate when necessary.

Make sure that you turn off the generation of blocked process reports by changing the ‘blocked process threshold’ sp_configure option back to 0 (zero) whenever you are not actively looking for blocked processes.
The Future – fn_dblog() No More? Tracking Transaction Log Activity in Denali
http://www.sqlskills.com/blogs/jonathan/an-xevent-a-day-22-of-31-the-future-fn_dblog-no-more-tracking-transaction-log-activity-in-denali/
fn_dblog() 函数不再需要,跟踪事务日志活动在sql2012
动态sql创建扩展事件,因为创建扩展事件的时候不能使用内联参数
I bet that made you look didn’t it?  Worry not, fn_dblog() still exists in SQL Server Denali, and I plan on using it to validate the information being returned by a new Event in SQL Server Denali CTP1, sqlerver.transaction_log, which brings with it the ability to correlate specific transaction log entries to the operations that actually caused them to occur.

There is no greater source of information about the transaction log in SQL Server than Paul Randal’s blog category Transaction Log.  It is also listed as the referenced pre-reading material for the Microsoft SQL Server MCM program Logging, Recovery, Log Maintenance topic.  In a number of his blog posts, Paul shows how to look at the transaction log by using an undocumented system function fn_dblog().  Note that I said it is undocumented, meaning its use is not supported by Microsoft, its functionality is subject to change at any point in time without notification, and its use is at your own risk.  Is it safe to use?  That’s a topic that is up for debate, but at the end of the day if you were to have a problem associated with its use you are on your own because its undocumented.

Why does any of this matter?  It matters because there is a lot of information that we can learn about the internal operations of SQL Server from the log operations that occur as the result of changes in our database.  Some examples of this would be:

A SQL Server DBA myth a day: (19/30) TRUNCATE TABLE is non-logged
Benchmarking: 1-TB table population (part 2: optimizing log block IO size and how log IO works)
Lock logging and fast recovery
How do checkpoints work and what gets logged
Finding out who dropped a table using the transaction log

Admittedly this isn’t necessarily information that you would start a conversation with at a party, unless of course you are surrounded by other ubergeeks SQL Server internal junkies, and its not really the kind of information that I use day to day in my work as a Database Administrator.  Prior to the introduction of Extended Events, some information about how SQL Server operated was only available inside of the transaction log records, and I am sure that there are still some items that you can only see inside of the log records.  Microsoft obviously recognized a demand to look the log operations generated by SQL Server in a supported fashion and added this functionality to Extended Events.

The sqlserver.transaction_log Event returns 10 data elements in its payload, which can be found in the sys.dm_xe_object_columns DMV.

SELECT
    oc.name,
    oc.type_name,
    oc.description
FROM sys.dm_xe_packages AS p
INNER JOIN sys.dm_xe_objects AS o
    ON p.guid = o.package_guid
INNER JOIN sys.dm_xe_object_columns AS oc
    ON oc.object_name = o.name
        AND oc.object_package_guid = o.package_guid
WHERE o.name = 'transaction_log'
  AND oc.column_type = 'data'
An XEvent a Day (22 of 31) – The Future – fn dblog() No More? Tracking Transaction Log Activity in Denali   image thumb

The operation and context elements have corresponding Maps in sys.dm_xe_map_values that provide the different Log Operations and Contexts that are available through Extended Events.  There are currently 70 Log Operations and 29 Contexts for those operations available in SQL Server Denali CTP1.

SELECT
    name,
    map_key,
    map_value
FROM sys.dm_xe_map_values
WHERE name in ('log_op', 'log_context')
ORDER BY name, map_key

To show how this Event can be used, we’ll first create a database named TransactionLogDemo, and then switch our connection to that database.  We’ll then create an table that will be used to generate some Transaction Log events.  We’ll create our Event Session to capture the sqlserver.sql_statement_starting, sqlserver.sql_statement_completed, and sqlserver.transaction_log Events and we’ll add a Predicate to each Event to only fire for the TransactionLogDemo database.  To add the Predicate dynamically, we’ll use Dynamic SQL to create our Event Session since inline parameters cannot be used in the CREATE EVENT SESSION DDL.

CREATE DATABASE TransactionLogDemo
GO
USE TransactionLogDemo
GO
CREATE TABLE CreateLogRecords
(RowID int identity primary key,
 RowData nvarchar(120))
GO
DECLARE @sqlcmd nvarchar(2000) = '
CREATE EVENT SESSION TransactionLogDemo
ON SERVER
ADD EVENT sqlserver.page_reference_tracker,
ADD EVENT sqlserver.sql_statement_starting
( ACTION(sqlserver.sql_text)
  WHERE (sqlserver.database_id = '+ cast(DB_ID() as varchar(3))+')
),
ADD EVENT sqlserver.sql_statement_completed
( ACTION(sqlserver.sql_text)
  WHERE (sqlserver.database_id = '+ cast(DB_ID() as varchar(3))+')
),
ADD EVENT sqlserver.transaction_log
( WHERE (sqlserver.database_id = '+ cast(DB_ID() as varchar(3))+'))
ADD TARGET package0.asynchronous_file_target(
     SET filename=''C:\SQLBlog\TransactionLogDemoDenali.xel'',
         metadatafile=''C:\SQLBlog\TransactionLogDemoDenali.xem'')
WITH (MAX_MEMORY = 4MB, EVENT_RETENTION_MODE = NO_EVENT_LOSS, TRACK_CAUSALITY = ON )'
EXEC (@sqlcmd)
GO
CHECKPOINT
GO
-- Start the Event Session
ALTER EVENT SESSION TransactionLogDemo
ON SERVER
STATE=START
GO

Once the Event Session is created, we’ll call CHECKPOINT on the database so that the log can truncate (you did create the database in SIMPLE recovery right?) and clear allowing our later call to fn_dblog() to only return the log records specific to the operations that occur after the CHECKPOINT.  We’ll start our Event Session, and then insert 20 rows into the CreateLogRecords table, and then immediately delete all of the rows from the table, and stop our Event Session to end the collection of Events.

INSERT INTO CreateLogRecords (RowData)
SELECT REPLICATE('abc123', 20)
FROM master.dbo.spt_values a
WHERE a.type = 'P'
  AND a.number < 20
GO
DELETE CreateLogRecords
GO
-- Disable the Event Session
ALTER EVENT SESSION TransactionLogDemo
ON SERVER
STATE=STOP
GO

Once this is done, we can now query the package0.asynchronous_file_target to get our Event data from Extended Events, and then at the same time query fn_dblog() to get the log records from the Transaction Log as well so that we can validate what we’ve collected in our Event Session.

-- Fetch the Event Data from the Event Session Target
SELECT
    XEvent.value('(event/@name)[1]', 'varchar(50)') AS event_name,
    DATEADD(hh,
            DATEDIFF(hh, GETUTCDATE(), CURRENT_TIMESTAMP),
            XEvent.value('(event/@timestamp)[1]', 'datetime2')) AS [timestamp],
    COALESCE(XEvent.value('(event/data[@name="database_id"]/value)[1]', 'int'),
             XEvent.value('(event/action[@name="database_id"]/value)[1]', 'int')) AS database_id,
    XEvent.value('(event/data[@name="index_id"]/value)[1]', 'int') AS [index_id],
    XEvent.value('(event/data[@name="object_id"]/value)[1]', 'int') AS [object_id],
    XEvent.value('(event/data[@name="transaction_id"]/value)[1]', 'int') AS [transaction_id],
    XEvent.value('(event/data[@name="log_record_size"]/value)[1]', 'int') AS [log_record_size],
    XEvent.value('(event/data[@name="operation"]/text)[1]', 'varchar(50)') AS [operation],
    XEvent.value('(event/data[@name="context"]/text)[1]', 'varchar(50)') AS [context],
    XEvent.value('(event/data[@name="transaction_start_time"]/value)[1]', 'datetime2') AS [transaction_start_time],
    XEvent.value('(event/data[@name="replication_command"]/value)[1]', 'int') AS [replication_command],
    XEvent.value('(event/action[@name="sql_text"]/value)[1]', 'varchar(1000)') AS [sql_text],
    CAST(SUBSTRING(XEvent.value('(event/action[@name="attach_activity_id"]/value)[1]', 'varchar(50)'), 1, 36) AS uniqueidentifier) as activity_id,
    CAST(SUBSTRING(XEvent.value('(event/action[@name="attach_activity_id"]/value)[1]', 'varchar(50)'), 38, 10) AS int) as event_sequence
FROM (
    SELECT CAST(event_data AS XML) AS XEvent
    FROM sys.fn_xe_file_target_read_file('C:\SQLBlog\TransactionLogDemoDenali*.xel', 'C:\SQLBlog\TransactionLogDemoDenali*.xem', null, null)) as src
ORDER BY
    DATEADD(hh,
            DATEDIFF(hh, GETUTCDATE(), CURRENT_TIMESTAMP),
            XEvent.value('(event/@timestamp)[1]', 'datetime2')),
    CAST(SUBSTRING(XEvent.value('(event/action[@name="attach_activity_id"]/value)[1]', 'varchar(50)'), 1, 36) AS uniqueidentifier),
    CAST(SUBSTRING(XEvent.value('(event/action[@name="attach_activity_id"]/value)[1]', 'varchar(50)'), 38, 10) AS int)
GO

-- Fetch Log records from log for comparison
SELECT
    [Xact ID] as transaction_id,
    [Log Record Fixed Length] as log_record_size,
    [Operation] as operation,
    SUBSTRING([context], 5, LEN(context)) as context,
    [Begin Time]
FROM fn_dblog(null, null)
GO

An XEvent a Day (22 of 31) – The Future – fn dblog() No More? Tracking Transaction Log Activity in Denali   image thumb

When we look at the output of the above two queries, first you’ll note that there are four log records that don’t have associated records in our Extended Event Session.  These are the log records generated by the CHECKPOINT operation and the ALTER EVENT SESSION command and occurred before the Event Session was actually collecting data.  The first two LOP_BEGIN_XACT records in the Event Session correspond to the transaction_id of the log records returned in rows 5 and 6 of the fn_dblog() output, but if you notice the Event Session is missing the transaction_start_time for the log operations, something I believe to be a bug in Denali CTP1 and which I’ve submitted a Connect item for (Denali – Transaction_Log Extended Event Returning Incorrect Data).

On quick glance it appears that all of our log records are in the same order, but if we look at more closely, there is a LOP_MODIFY_ROW operation that is missing from our Event Session, but exists inside of the fn_dblog() output.

An XEvent a Day (22 of 31) – The Future – fn dblog() No More? Tracking Transaction Log Activity in Denali   image thumb

If you scroll down further, you’ll also see that there are two missing log records for the delete as well, LOP_MODIFY_HEAP and LOP_SET_BITS with a context of PFS.  However, the Extended Event Session captures the lock logging for the ALTER EVENT SESSION command that stopped the Event collection, whereas the output from fn_dblog() does not show that.

To cleanup from this Event Session, the following code can be run.

USE master
GO
DROP DATABASE TransactionLogDemo
GO
DROP EVENT SESSION TransactionLogDemo
ON SERVER
GO
EXECUTE sp_configure 'show advanced options', 1
GO
RECONFIGURE
GO
EXECUTE sp_configure 'xp_cmdshell', 1
GO
RECONFIGURE
GO
EXEC xp_cmdshell 'DEL C:\SQLBlog\TransactionLogDemoDenali*'
GO
EXECUTE sp_configure 'xp_cmdshell', 0
GO
RECONFIGURE
GO
EXECUTE sp_configure 'show advanced options', 0
GO
RECONFIGURE
GO
How it Works – Multiple Transaction Log Files
http://www.sqlskills.com/blogs/jonathan/an-xevent-a-day-23-of-31-how-it-works-multiple-transaction-log-files/
这是怎样工作的,多个事务日志文件
While working on yesterday’s blog post The Future – fn_dblog() No More? Tracking Transaction Log Activity in Denali I did a quick Google search to find a specific blog post by Paul Randal to use it as a reference, and in the results returned another blog post titled, Investigating Multiple Transaction Log Files in SQL Server caught my eye so I opened it in a new tab in IE and went about finishing the blog post.  It probably wouldn’t have gotten my attention if it hadn’t been on the SqlServerPedia site.  When I was finished I went back and read through the post, and I found that some of the information presented in it was incorrect, so I attempted to post a comment, and not surprisingly the blog had moderation controls turned on, I have it turned on here if you aren’t a SQLBlog member so I don’t have a problem with that necessarily, and the comment didn’t show up on the site.

Interestingly enough, yesterday SQL Server Central had an editorial by Tim Mitchell titled Calling Out Bad Advice that discussed the problem of bad information on the internet and how to go about calling people out for publishing bad advice.  Lets face it, people are human, at least I am, and mistakes happen from time to time, either through our own misunderstandings of our personal experiences and what we perceived from the information we had, or by shear accident in some cases.  This afternoon I got an email back from the blog post author and we traded a few emails about the post, and in the end the author made changes to the original post which have been syndicated to SQLServerPedia already, so to see the original you have do something like look at the Google Cached Copy.  The author also posted a follow up blog post today on the subject.

So why this blog post?  Well even with the corrections, some of the conclusions are still wrong.

An XEvent a Day (23 of 31) – How it Works – Multiple Transaction Log Files   image thumb

I am not trying to knock this guy for what he saw or perceived from the information he collected, but 2, 3 and 4 are still incorrect.  What’s great is we can prove this by using Extended Events in SQL Server 2008 and that is what the real purpose behind this blog post is.  To set things up, we first need to create a database that roughly matches the available information shown in the pictures of the original blog post.  The database will have a single database file, that I am sizing initially at 128MB and will have a fixed autogrowth value of 64MB.  The database will have four log files that are initially sized at 1MB each, and the first log file will have a fixed autogrowth value of 32MB, with the last three transaction log files having fixed growth values of just 1MB.  Don’t comment on this configuration, I understand completely that there is no reason to create multiple log files on the same disk array (half the purpose behind this post is to show that there is no benefit to having multiple log files like this, which is also the intended purpose behind the original blog post as well), and I wouldn’t do this in production, but it works perfectly for the tests that we are about to run.  Once the database is created, we’ll switch to that database, and dump out the transaction log VLF information using DBCC LOGINFO.

-- Create our Test database with
--        1 data file sized at 128MB with 64MB autogrowth
--        1 log file sized at 1MB with 32MB autogrowth
--        3 log files sized at 1MB with 1MB autogrowth
CREATE DATABASE [Test] ON
PRIMARY
    (
        NAME = N'Test',
        FILENAME = N'D:\SQLData\MSSQL10.MSSQLSERVER\MSSQL\DATA\Test.mdf',
        SIZE = 131072KB,
        FILEGROWTH = 65536KB
    )
LOG ON
    (
        NAME = N'Test_log',
        FILENAME = N'L:\SQLData\MSSQL10.MSSQLSERVER\MSSQL\DATA\Test_log.ldf',
        SIZE = 1024KB,
        MAXSIZE = 131072KB,
        FILEGROWTH = 32768KB
    ),
    (
        NAME = N'Test_log2',
        FILENAME = N'L:\SQLData\MSSQL10.MSSQLSERVER\MSSQL\DATA\Test_log2.ldf',
        SIZE = 1024KB,
        MAXSIZE = 131072KB,
        FILEGROWTH = 1024KB
    ),
    (
        NAME = N'Test_log3',
        FILENAME = N'L:\SQLData\MSSQL10.MSSQLSERVER\MSSQL\DATA\Test_log3.ldf',
        SIZE = 1024KB,
        MAXSIZE = 131072KB,
        FILEGROWTH = 1024KB
    ),
    (
        NAME = N'Test_log4',
        FILENAME = N'L:\SQLData\MSSQL10.MSSQLSERVER\MSSQL\DATA\Test_log4.ldf',
        SIZE = 1024KB,
        MAXSIZE = 131072KB,
        FILEGROWTH = 1024KB
    )
GO
-- Switch to our Test database
USE [Test]
GO
-- Dump the VLF Usage information
DBCC LOGINFO
GO

An XEvent a Day (23 of 31) – How it Works – Multiple Transaction Log Files   image thumb

Each of the log files VLF’s have been highlighted in a different color above to point out the separation of the four different files.  Note that the active VLF is in the first log file, FileId=2, as shown by the Status=2.  With our test database created, we can now set out to create the Extended Events Event Session that:

The transaction logs are written to sequentially starting with the first VLF in FileId=2 and then when the last VLF in FileId=2 is full, the log begins writing log records to the first VLF of FileId=3 and when the last VLF in FileId=3 is full, the log begins writing log records to the first VLF of FileId=4 and when the last VLF in FileId=4 is full, the log begins writing log records to the first VLF of FileId=5 and when the last VLF in FileId=5 is full, the log circles back to the first VLF of FileId=2 which will still be active because we are going to work within a single explicit transaction for the duration of the test.  Since the file is full it has to be grown, and because it has a growth factor of 32MB it grows by 32MB and begins writing log records to the first VLF of the newly allocated space.
The writes to the log files do not happen at the same time, they occur sequentially as the engine writes log records into each file, filling the VLF’s and has to move to the next file, or circle back to the beginning of the log when it reaches the end of the last log file.
Whatever results were seen in the original thread by opening the log file with Apex tools were incorrect and misleading to the original poster, since log files were actually written to all of the files during the operation.  I have a couple of theories as to what could have happened that made the Apex tool show no log records that I will discuss later in this thread.
What Events would we want to capture to look at what is happening in our transaction log files when running the same workload from the original post?  Since we are going to be executing a number of statements, the sqlserver.sql_statement_starting and sqlserver.sql_statement_completed Events seem like a good starting point, and since we want to know what statement was executing, we’ll add the sql_text Action to these Events.  Since we are dealing with the transaction log files, the sqlserver.databases_log_file_size_changed, sqlserver.databases_log_file_used_size_changed, sqlserver.databases_log_flush_wait, sqlserver.databases_log_flush, sqlserver.databases_log_growth, and sqlserver.databases_log_truncation Events should probably be included to so we can track what’s going on with our log specifically, and to ensure that these Events only fire for our test database, we’ll dynamically build in a Predicate on the sqlserver.database_id Predicate source using the output of DB_ID() inside the testing database.

Since the log is a file, we also will want to collect the file operation related events such as sqlserver.flush_file_buffers, sqlserver.file_read, sqlserver.file_written, sqlserver.file_read_completed, and sqlserver.file_write_completed, and we’ll dynamically set a database_id Predicate on these Events as well.  If you recall back to Friday of last week, I talked about a number of trace flags that provide further information about Backup, Restore and file operations in my blog post A Look at Backup Internals and How to Track Backup and Restore Throughput (Part 1).  One of those was Trace Flag 3004, which writes file zeroing information to the trace print output whenever a zeroing operation occurs.  I previously used this trace flag in my blog post Does the tempdb Log file get Zero Initialized at Startup?  Since the log files grew in the original tests, we can turn this trace flag on to track the file growths, and use the sqlserver.trace_print Event to capture the file operation messages, and to keep this Event focused to our tests only, we’ll dynamically set a Predicate for the current session_id using the sqlserver.session_id Predicate Source and the output of @@SPID.  Finally since this is all happening inside of an explicit transaction, we’ll also capture the sqlserver.database_transaction_begin and sqlserver.database_transaction_end events for the current database_id.

We have quite a large list of Events associated with this Event Session, and to ensure that we can perform analysis over all of the Event data from our tests, we’ll use the package0.asynchronous_file_target to hold our Event information.  We’ll also increase our buffer memory from the default 4MB to 8MB and set the Event Session up to ALLOW_SINGLE_EVENT_LOSS, which does exactly what it sounds like it does, and to correlate cause and effect we’ll also turn TRACK_CAUSALITY to ON for the session.

-- Create our Event Session dynamically
DECLARE @sqlcmd nvarchar(2000) = '
CREATE EVENT SESSION TransactionLogUsage
ON SERVER
--ADD EVENT sqlserver.sql_statement_starting
--( ACTION(sqlserver.sql_text)
--  WHERE (sqlserver.database_id = '+ cast(DB_ID() as varchar(3))+')),
--ADD EVENT sqlserver.sql_statement_completed
--( ACTION(sqlserver.sql_text)
--  WHERE (sqlserver.database_id = '+ cast(DB_ID() as varchar(3))+')),
ADD EVENT sqlserver.databases_log_file_size_changed
( WHERE (sqlserver.database_id = '+ cast(DB_ID() as varchar(3))+')),
ADD EVENT sqlserver.databases_log_file_used_size_changed
( WHERE (sqlserver.database_id = '+ cast(DB_ID() as varchar(3))+')),
ADD EVENT sqlserver.databases_log_flush_wait
( WHERE (sqlserver.database_id = '+ cast(DB_ID() as varchar(3))+')),
ADD EVENT sqlserver.databases_log_flush
( WHERE (sqlserver.database_id = '+ cast(DB_ID() as varchar(3))+')),
ADD EVENT sqlserver.databases_log_growth
( WHERE (sqlserver.database_id = '+ cast(DB_ID() as varchar(3))+')),
ADD EVENT sqlserver.databases_log_truncation
( WHERE (sqlserver.database_id = '+ cast(DB_ID() as varchar(3))+')),
ADD EVENT sqlserver.flush_file_buffers
( WHERE (sqlserver.database_id = '+ cast(DB_ID() as varchar(3))+')),
ADD EVENT sqlserver.file_read
( WHERE (sqlserver.database_id = '+ cast(DB_ID() as varchar(3))+')),
ADD EVENT sqlserver.file_written
( WHERE (sqlserver.database_id = '+ cast(DB_ID() as varchar(3))+')),
ADD EVENT sqlserver.file_read_completed
( WHERE (sqlserver.database_id = '+ cast(DB_ID() as varchar(3))+')),
ADD EVENT sqlserver.file_write_completed
( WHERE (sqlserver.database_id = '+ cast(DB_ID() as varchar(3))+')),
ADD EVENT sqlserver.trace_print
(   WHERE (sqlserver.session_id = '+ cast(@@SPID as varchar(4))+')),
ADD EVENT sqlserver.database_transaction_begin
( WHERE (sqlserver.database_id = '+ cast(DB_ID() as varchar(3))+')),
ADD EVENT sqlserver.database_transaction_end
( WHERE (sqlserver.database_id = '+ cast(DB_ID() as varchar(3))+'))
ADD TARGET package0.asynchronous_file_target(
     SET filename=''C:\SQLBlog\TransactionLogUsage.xel'',
         metadatafile=''C:\SQLBlog\TransactionLogUsage.xem'')
WITH (MAX_MEMORY = 8MB, EVENT_RETENTION_MODE = ALLOW_SINGLE_EVENT_LOSS, TRACK_CAUSALITY = ON )'
EXEC (@sqlcmd)
GO

If you notice above, I have commented out the sqlserver.sql_statement_starting and sqlserver.sql_statement_completed Events in the Event Session.  It turns out that these two events are not needed in the Event Session to prove the points being made in this blog post.  Including these two events makes the time to process the 240K+ Events run in the 10-15 minute range on my 16 core test server, so its not likely something that you are going to do on a laptop VM, but they were included in my initial Event Session for this, and I wanted to show the thought process I followed to get from A to B and ultimately C.

With our Event Session created, we can finish setting up our environment to run the actual tests.  To do this we’ll create a table named LogTable with two columns that are, as best as I can tell from the limited information provided about the test table, the same as the table used in the original post.  We’ll then CHECKPOINT the database to cause log truncation to occur (you did create the database in SIMPLE recovery right?), turn on Trace Flag 3004 for our session, and then start the Event Session so that it collects the data from our Events during our test.

-- Create our Test Table
CREATE TABLE LogTable (RowID decimal(10,4), Data char(1024))
GO
-- Checkpoint the database to truncate and clear the log.
CHECKPOINT
GO
-- Turn on Trace Flag 3004 so we can see file zeroing ops.
DBCC TRACEON(3004)
GO
-- Start the Event Session
ALTER EVENT SESSION TransactionLogUsage
ON SERVER
STATE=START
GO

With the Event Session started and all our setup work completed we can now run the test script that was used in the original post to generate our test workload.  When the tests complete, we’ll dump out our VLF information again with DBCC LOGINFO, then ROLLBACK the transaction, switch to master and DROP our test database and the Extended Events Session from the server since they are no longer needed.

-- Run our tests
SET NOCOUNT ON

DECLARE @cnt decimal(10,4)=0
DECLARE @rows int=0
BEGIN TRAN
WHILE 1=1
BEGIN
    INSERT INTO LogTable VALUES (ROUND((RAND()* 1000000),0), SPACE(1024))

    SELECT @rows+=1

    SELECT @cnt = (size * 1.0 * 8.0)/1024.0
    FROM  Test.sys.database_files
    WHERE data_space_id = 0
    AND [FILE_ID]=5

    IF @cnt>1.0
            BREAK
END

SELECT @rows;
GO
-- Pull Log VLF usage again
DBCC LOGINFO
GO
-- Rollback our transaction
ROLLBACK
GO
USE master
GO
-- Kill any connection to Test database
ALTER DATABASE [Test] SET SINGLE_USER WITH ROLLBACK IMMEDIATE;
GO
-- Drop the Test database
DROP DATABASE [Test]
GO
-- Drop the Event Session
DROP EVENT SESSION TransactionLogUsage
ON SERVER
GO
An XEvent a Day (23 of 31) – How it Works – Multiple Transaction Log Files   image3 thumb

There is a reason that I dump out the VLF information before performing the ROLLBACK of the transaction.  As long as the transaction remains active, the VLF’s containing the active transaction can not be truncated and cleared.  In order to see the allocated VLF’s, we need the transaction active still.  Once again, I have highlighted each of the individual log files separately, and from the DBCC LOGINFO output we can look at the FileId and Status columns and see that our transaction log wrote information into all 4 of the files, filling them, and the wrapped back to the first file which had to be grown, and each of the subsequent log files were also grown by the database engine.  However, if you look at the CreateLSN information for the growth portion of each log file, you will notice that each file has its own Create LSN value for the second set of VLF’s, meaning that they were grown separately and at different times.  Still not convinced by DBCC LOGINFO?  Well we have the data to validate this and prove it unequivocally, but before we can look at the data, we need to retrieve it from the asynchronous_file_target files and shred the XML using XQuery.

-- Create our Analysis Database
CREATE DATABASE TLogUsageTestResults
GO
-- Switch to our Analysis Database
USE [TLogUsageTestResults]
GO
-- Create intermediate temp table for raw event data
CREATE TABLE RawEventData
(Rowid int identity primary key, event_data xml)

-- Create final results table for parsed event data
CREATE TABLE TestResults
([Rowid] int primary key, [event_name] varchar(50), [package_name] varchar(50),
 [timestamp] datetime2, [count] bigint, [increment] bigint, [database_id] int,
 [mode] nvarchar(4000), [file_handle] nvarchar(4000), [offset] bigint,
 [file_id] int, [file_group_id] int, [path] nvarchar(4000), [duration] bigint,
 [io_data] nvarchar(4000), [succeeded] nvarchar(4000), [sql_text] nvarchar(4000),
 [trace_message] nvarchar(4000), [source_database_id] int, [object_id] int,
 [object_type] int, [cpu] int, [reads] bigint, [writes] bigint,
 [state] nvarchar(4000), [offset_end] int, [nest_level] int,
 [activity_id] uniqueidentifier, [event_sequence] int )

-- Read the file data into intermediate temp table
INSERT INTO RawEventData (event_data)
SELECT
    CAST(event_data AS XML) AS event_data
FROM sys.fn_xe_file_target_read_file('C:\SQLBlog\TransactionLogUsage*.xel',
                                     'C:\SQLBlog\TransactionLogUsage*.xem',
                                     null, null)

-- Query the Event data from the Target.
INSERT INTO TestResults
([Rowid], [event_name], [timestamp], [database_id], [count], [increment],
 [mode], [file_handle], [offset], [file_id], [file_group_id], [path],
 [duration], [io_data], [succeeded], [sql_text], [trace_message], [source_database_id],
 [object_id], [object_type], [cpu], [reads], [writes], [state], [offset_end],
 [nest_level], [activity_id], [event_sequence])

-- Fetch the Event Data from the Event Session Target
SELECT
    RowID,
    event_data.value('(event/@name)[1]', 'varchar(50)') AS event_name,
    DATEADD(hh,
            DATEDIFF(hh, GETUTCDATE(), CURRENT_TIMESTAMP),
            event_data.value('(event/@timestamp)[1]', 'datetime2')) AS [timestamp],
    COALESCE(event_data.value('(event/data[@name="database_id"]/value)[1]', 'int'),
             event_data.value('(event/action[@name="database_id"]/value)[1]', 'int')) AS database_id,
    event_data.value('(event/data[@name="count"]/value)[1]', 'bigint') AS [count],
    event_data.value('(event/data[@name="increment"]/value)[1]', 'bigint') AS [increment],
    event_data.value('(event/data[@name="mode"]/text)[1]', 'nvarchar(4000)') AS [mode],
    event_data.value('(event/data[@name="file_handle"]/value)[1]', 'nvarchar(4000)') AS [file_handle],
    event_data.value('(event/data[@name="offset"]/value)[1]', 'bigint') AS [offset],
    event_data.value('(event/data[@name="file_id"]/value)[1]', 'int') AS [file_id],
    event_data.value('(event/data[@name="file_group_id"]/value)[1]', 'int') AS [file_group_id],
    event_data.value('(event/data[@name="path"]/value)[1]', 'nvarchar(4000)') AS [path],
    event_data.value('(event/data[@name="duration"]/value)[1]', 'bigint') AS [duration],
    event_data.value('(event/data[@name="io_data"]/value)[1]', 'nvarchar(4000)') AS [io_data],
    event_data.value('(event/data[@name="succeeded"]/value)[1]', 'nvarchar(4000)') AS [succeeded],
    event_data.value('(event/action[@name="sql_text"]/value)[1]', 'nvarchar(4000)') AS [sql_text],
    event_data.value('(event/data[@name="message"]/value)[1]', 'nvarchar(4000)') AS [trace_message],
    event_data.value('(event/data[@name="source_database_id"]/value)[1]', 'int') AS [source_database_id],
    event_data.value('(event/data[@name="object_id"]/value)[1]', 'int') AS [object_id],
    event_data.value('(event/data[@name="object_type"]/value)[1]', 'int') AS [object_type],
    event_data.value('(event/data[@name="cpu"]/value)[1]', 'int') AS [cpu],
    event_data.value('(event/data[@name="reads"]/value)[1]', 'bigint') AS [reads],
    event_data.value('(event/data[@name="writes"]/value)[1]', 'bigint') AS [writes],
    event_data.value('(event/data[@name="state"]/text)[1]', 'nvarchar(4000)') AS [state],
    event_data.value('(event/data[@name="offset_end"]/value)[1]', 'int') AS [offset_end],
    event_data.value('(event/data[@name="nest_level"]/value)[1]', 'int') AS [nest_level],
    CAST(SUBSTRING(event_data.value('(event/action[@name="attach_activity_id"]/value)[1]', 'varchar(50)'), 1, 36) AS uniqueidentifier) as activity_id,
    CAST(SUBSTRING(event_data.value('(event/action[@name="attach_activity_id"]/value)[1]', 'varchar(50)'), 38, 10) AS int) as event_sequence
FROM RawEventData
ORDER BY Rowid
GO

-- Return our results
SELECT *
FROM TestResults
WHERE event_name NOT IN ('sql_statement_starting' , 'sql_statement_completed')
ORDER BY RowID

If you scroll through the results you can see the writes occurring sequentially through each of the log files, and while FileId=4 is being written to, the Database Engine begins the growth of FileId=2 by 32MB.  If we change our query to only focus on the file_write_completed, databases_log_growth, and trace_print Events, we can see this a little easier.

-- Return our results
SELECT
    Rowid,
    event_name,
    [timestamp],
    [count],
    database_id,
    mode,
    offset,
    file_id,
    duration,
    trace_message
FROM TestResults
WHERE event_name  IN ('file_write_completed' , 'databases_log_growth', 'trace_print')
ORDER BY RowID

An XEvent a Day (23 of 31) – How it Works – Multiple Transaction Log Files   image thumb           An XEvent a Day (23 of 31) – How it Works – Multiple Transaction Log Files   image thumb
Log Rollover from Log1 to Log2         Log Rollover from Log2 to Log3


An XEvent a Day (23 of 31) – How it Works – Multiple Transaction Log Files   image thumb

      An XEvent a Day (23 of 31) – How it Works – Multiple Transaction Log Files   image thumb
Autogrow of Log1         Log Rollover from Log3 to Log4


An XEvent a Day (23 of 31) – How it Works – Multiple Transaction Log Files   image thumb           An XEvent a Day (23 of 31) – How it Works – Multiple Transaction Log Files   image thumb
Log Rollover from Log4 back to Log1         Autogrow of Log2


An XEvent a Day (23 of 31) – How it Works – Multiple Transaction Log Files   image thumb           An XEvent a Day (23 of 31) – How it Works – Multiple Transaction Log Files   image thumb
Autogrow of Log3         Autogrow of Log4

We can see the first log file, FileID=2, grows before the log rollover from Log3, FileID=4, occurs to Log4, FileID=5, making space available in the first log file for the rollover when FileID=5 becomes full.  Log records are written all four of the log files before the log wraps back around to the first log file, debunking point numbers two and four of the conclusion.  The timestamps of the events shows that the additional log files are written to serially and not at the same time debunking point number three of the conclusion.  The reason that only a fraction of the log records are written to the three additional log files is proportionate to the difference in the autogrowth settings between the first log file at 32MB and the three additional log files at 1MB.  If the first log file was set to grow at 1MB, the majority of the log records would not be in the first log file.

Its been well documented that there is no performance benefit to having multiple log files in a database, and Paul Randal’s blog post, Importance of proper transaction log size management, was linked to in the original blog post that ultimately triggered this post.  The behavior demonstrated in this post isn’t a mystery, its documented in the Books Online (Transaction Log Physical Architecture), but sometime empirical evidence like this helps solidify that fact.
What is the callstack?
http://www.sqlskills.com/blogs/jonathan/an-xevent-a-day-24-of-31-what-is-the-callstack/
callstack是什么,调用堆栈是什么?
One of the actions inside of Extended Events is the package0.callstack and the only description provided by sys.dm_xe_objects for the object is 16-frame call stack. If you look back at The system_health Session blog post, you’ll notice that the package0.callstack Action has been added to a number of the Events that the PSS team thought were of significance to include in the Event Session. We can trigger an event that will by logged by our system_health Event Session by raising an error of severity >=20 with the RAISERROR functionality in TSQL. -- Generate a Severity 20 Error to trigger system_health -- sqlserver.error_reported Event RAISERROR(50001, 20, 1, 'This is an Error!') WITH LOG An XEvent a Day (24 of 31) – What is the callstack? image thumb After raising the error, we can query the system_health Event Session for the callstacks that have been collected by adding into our XQuery a filter for the action node with the @name attribute = “callstack” SELECT n.query('.') AS callstack FROM ( SELECT CAST(target_data as xml) FROM sys.dm_xe_sessions AS s INNER JOIN sys.dm_xe_session_targets AS t ON s.address = t.event_session_address WHERE s.name = 'system_health' AND t.target_name = 'ring_buffer' ) AS src (target_data) CROSS APPLY target_data.nodes('RingBufferTarget/event/action[@name="callstack"]') as q(n) This will only return the action nodes for the callstack and the XML fragment will be similar to the following: <action name="callstack" package="package0"> <type name="callstack" package="package0" /> <value>0x0000000001CD4F55 0x000000000113A310 0x0000000000BEA7D0 0x0000000001A3A0CC 0x0000000002FA3EAE 0x0000000000BC9616 0x0000000000BCABBB 0x0000000000BCA4D9 0x0000000000BCD10B 0x0000000000BC7C9B 0x0000000000B6163B 0x0000000000B612FA 0x0000000000B60E35 0x00000000010E0E50 0x00000000010E09A0 0x00000000010F9AB0</value> <text /> </action> So what is it about this information that would make it important enough to collect? The callstack provides the most recent 16 frames inside of the sqlservr process. If you create a dump file of the sqlservr process using sqldumper.exe, you canopen the mdmp file up in windbg, load the public symbols for sql Server, and then walk the stack with the ln <stack address> command. For example the above callstack resolves in windbg as: (00000000`01cd4f10) sqlservr!GenericEvent::CallNextAction+0×45 | (00000000`01cd5000) sqlservr!AutoSpinlockHolder<170,1,1>::~AutoSpinlockHolder<170,1,1> (00000000`00b78be0) sqlservr!_chkstk+0xf276c | (00000000`00b78c30) sqlservr!IsWorktableRowset (00000000`00bea640) sqlservr!ErrorReportedAutoPublish::Publish+0×190 | (00000000`00bea820) sqlservr!CErrorReportingManager::CwchCallFormatMessage (00000000`00b78be0) sqlservr!_chkstk+0x1bd96d | (00000000`00b78c30) sqlservr!IsWorktableRowset (00000000`02fa3800) sqlservr!CXStmtError::XretExecute+0x6ae | (00000000`02fa44b0) sqlservr!CStmtDbcc::XretExecute (00000000`00bc8f80) sqlservr!CMsqlExecContext::ExecuteStmts<1,1>+0x55a | (00000000`00bc9e30) sqlservr!CSessionTaskProxy::AddRef (00000000`00bca630) sqlservr!CMsqlExecContext::FExecute+0x58b | (00000000`00bcad60) sqlservr!CExecParamTblHelperForExecParamTable::`vftable’ (00000000`00bca1c0) sqlservr!CSQLSource::Execute+0×319 | (00000000`00bca630) sqlservr!CMsqlExecContext::FExecute (00000000`00bcd1a0) sqlservr!process_request+0×370 | (00000000`00bcd6c0) sqlservr!CAutoSetupCXCtxtS::~CAutoSetupCXCtxtS (00000000`00bc7990) sqlservr!process_commands+0x2b2 | (00000000`00bc7c10) sqlservr!CConnection::PNetConn (00000000`00b61520) sqlservr!SOS_Task::Param::Execute+0x11b | (00000000`00b616f0) sqlservr!Worker::Reset (00000000`00b61230) sqlservr!SOS_Scheduler::RunTask+0xca | (00000000`00b61520) sqlservr!SOS_Task::Param::Execute (00000000`00b60da0) sqlservr!SOS_Scheduler::ProcessTasks+0×95 | (00000000`00b61090) sqlservr!WorkDispatcher::DequeueTask (00000000`010e0d40) sqlservr!SchedulerManager::WorkerEntryPoint+0×110 | (00000000`010e0ea0) sqlservr!SOSQueueCounted<Worker,0>::Dequeue (00000000`010e0940) sqlservr!SystemThread::RunWorker+0×60 | (00000000`010e0a10) sqlservr!SchedulerManager::AcquireWorker (00000000`010f9980) sqlservr!SystemThreadDispatcher::ProcessWorker+0x12c | (00000000`010f9b00) sqlservr!SEList<SystemThread,112>::Head An XEvent a Day (24 of 31) – What is the callstack? image thumb This information isn’t really of much use unless you have access to or understand the SQL Server Source code. In the event that you have an issue, the PSS team can create a memory dump of the process, collect the output from the ring_buffer target, and walk the stack to see what lead to the Event firing. It is possible to materialize the stack without having to actually perform a memory dump and without using windbg. In the SQLCAT team blog post Resolving DTC Related Waits and Tuning Scalability of DTC, Trace Flag 3656 is documented as materializing the callstack if the sqlservr.pdb symbols file exists in the same directory as sqlservr.exe. NOTE: There is a reason that this functionality is not turned on by default in SQL Server. It is not recommended that you enable this Trace Flag on a production server unless directed to do so by PSS as a part of a support case. This Trace Flag can impact performance and should not be used lightly. In SQL Server 2008, the symbols file is not included by default in the product. To get the symbols file, you can use windbg and a memory dump. For steps on how to do this, see http://blogs.msdn.com/b/askjay/archive/2009/12/29/basic-debugging-concepts-and-setup.aspx. Once you open the memory dump file for the first time, the symbols are downloaded from the public symbols server and placed in the .sympath specified, in the case of the blog post mentioned it will be C:\symbols\public\sq\sqlservr.pdb\1E7168D2F78B4FBA911F507689D7DE902. After copying the pdb to the Binn folder for the SQL instance, by default C:\Program Files\Microsoft SQL Server\MSSQL10.MSSQLSERVER\MSSQL\Binn, we can turn on the trace flag and requery our Event Session. --Trace flag 3656 enables the call stacks to be resolved. This requires that the --sqlservr.pdb file reside in the same directory as sqlservr.exe DBCC TRACEON (3656, -1) GO SELECT n.query('.') AS callstack FROM ( SELECT CAST(target_data as xml) FROM sys.dm_xe_sessions AS s INNER JOIN sys.dm_xe_session_targets AS t ON s.address = t.event_session_address WHERE s.name = 'system_health' AND t.target_name = 'ring_buffer' ) AS src (target_data) CROSS APPLY target_data.nodes('RingBufferTarget/event/action[@name="callstack"]') as q(n) The output of our callstack action is now: <action name="callstack" package="package0"> <type name="callstack" package="package0" /> <value>GenericEvent::CallNextAction+45 [ @ 0+0x0 _chkstk+f276c [ @ 0+0x0 ErrorReportedAutoPublish::Publish+190 [ @ 0+0x0 _chkstk+1bd96d [ @ 0+0x0 CXStmtError::XretExecute+6ae [ @ 0+0x0 CMsqlExecContext::ExecuteStmts<1,1>+55a [ @ 0+0x0 CMsqlExecContext::FExecute+58b [ @ 0+0x0 CSQLSource::Execute+319 [ @ 0+0x0 process_request+370 [ @ 0+0x0 process_commands+2b2 [ @ 0+0x0 SOS_Task::Param::Execute+11b [ @ 0+0x0 SOS_Scheduler::RunTask+ca [ @ 0+0x0 SOS_Scheduler::ProcessTasks+95 [ @ 0+0x0 SchedulerManager::WorkerEntryPoint+110 [ @ 0+0x0 SystemThread::RunWorker+60 [ @ 0+0x0 SystemThreadDispatcher::ProcessWorker+12c [ @ 0+0x0</value> <text /> </action> If you note, these match up to the stack output from windbg. If you are interested in trying to figure out the internal stack of SQL Server, the package0.callstack event can certainly be useful, but in general it is not something that you will get much use of in general troubleshooting with Extended Events.
Configuring Session Options
http://www.sqlskills.com/blogs/jonathan/an-xevent-a-day-26-of-31-configuring-session-options/
配置会话选项
EVENT_RETENTION_MODE 事件保留模式
ALLOW_SINGLE_EVENT_LOSS:默认
MAX_DISPATCH_LATENCY 最大分发延迟
默认是30秒,最小值1秒,如果设置为0或INFINITE 则等到memory buffer满才分发
MAX_EVENT_SIZE 最大事件大小
默认是0KB,即允许最大事件大小为一个单独的memory buffer的大小,最小只能设置为64KB
MAX_MEMORY 最大内存
默认是4MB
MEMORY_PARTITION_MODE 内存分区模式
默认是NONE
STARTUP_STATE 随着sqlserver启动而启动
TRACK_CAUSALITY 跟踪attach_activity_id
There are 7 Session level options that can be configured in Extended Events that affect the way an Event Session operates.  These options can impact performance and should be considered when configuring an Event Session.  I have made use of a few of these periodically throughout this months blog posts, and in today’s blog post I’ll cover each of the options separately, and provide further information about their usage.  Mike Wachal from the Extended Events team at Microsoft, talked about the Session options on his blog post, Option Trading: Getting the most out of the event session options, and I’d recommend giving it a read for additional information as well.

EVENT_RETENTION_MODE

The EVENT_RETENTION_MODE option specifies how the Event Session handles Event loss when Events generate faster than they can be dispatched to the Targets.  There are three possible values for this option; ALLOW_SINGLE_EVENT_LOSS, ALLOW_MULTIPLE_EVENT_LOSS, and NO_EVENT_LOSS.  This option directly affects the possible impact that an Event Session may have on the performance of a system while the Event Session is active.  A trade off occurs between performance impact and the guarantee whether all Events are captured or not.

ALLOW_SINGLE_EVENT_LOSS

The ALLOW_SINGLE_EVENT_LOSS value is the system default for all Event Sessions where the EVENT_RETENTION_MODE is not explicitly specified as a part of the Event Session definition.  This value allows single events to be dropped and lost from the session when the memory buffers for the Event Session are full and dispatch to the Targets can not keep up with the Event generation.

ALLOW_MULTIPLE_EVENT_LOSS

The ALLOW_MULTIPLE_EVENT_LOSS value allows an entire memory buffer containing multiple events to be dropped and lost when the memory buffers are full and the Events are generating faster than the buffers can be dispatched to the Targets.  This can minimize the performance impact on the server at the trade off that many Events could potentially be lost, with the number of Events lost depending on the size of the Events being generated, the configuration of the MAX_MEMORY session option, and the MEMORY_PARTITION_MODE session option.

NO_EVENT_LOSS

The NO_EVENT_LOSS value guarantees that all Events that fire are captured, but at the expense of possible system performance degradation when the Event Session is active.  If the memory buffers are all full and an Event fires, the task firing the Event will wait until space is available in a memory buffer for the Event to be buffered.  This option value is not recommended by the Extended Events team at Microsoft for most Event Sessions and should be used with extreme caution and only when it is absolutely necessary that every Event be captured, even at the expense of degraded performance of the system.

MAX_DISPATCH_LATENCY

The MAX_DISPATCH_LATENCY option specifies the time in seconds that Events are held in a memory buffer that is not full before being dispatched to the asynchronous session Targets.  The default value if the MAX_DISPATCH_LATENCY is not explicitly defined in the Session definition is 30 seconds, and the option has a minimum value of 1 second.  If a value of 0 or INFINITE is specified, the Events held in a memory buffer will not be dispatched until the memory buffer becomes full.

MAX_EVENT_SIZE

The MAX_EVENT_SIZE option specifies the maximum size in kilobytes or megabytes an individual Event can be.  The default value for this option when it is not explicitly set in the Session definition is 0KB, allowing the maximum Event size to be the size of a single memory buffer in the Event Session.  This option can be explicitly set to allow Events that are larger than a single memory buffer to be captured by the Event Session.  The minimum value for this option is 64KB.

MAX_MEMORY

The MAX_MEMORY option specifies the amount of memory in kilobytes or megabytes that is allocated to the memory buffers for the Event Session.  The value of this options is divided evenly amongst the memory buffers that are created for the Event Session based on the configuration of the MEMORY_PARTITION_MODE session option.  The MAX_MEMORY option can be used to increase the memory available for buffering Events when a large number of Events are expected to fire, minimizing Event loss due to full memory buffers.  The default value for this option is 4 megabytes (MB) or 4096 kilobytes (KB).

Mike Wachal blogged about this option on the Extended Events blog Take it to the MAX (and beyond), and again in response to a number of questions that I sent him early on in this blog series when I was working on a large NUMA based server, Session memory – who’s this guy named Max and what’s he doing with my memory?

MEMORY_PARTITION_MODE

The MEMORY_PARTITION_MODE option specifies how the memory buffers for the Event Session are created and/or partitioned.  For servers with multiple processors and/or multiple NUMA nodes the memory buffers can become a bottleneck performance wise if multiple CPU’s are firing Events and have to wait on a memory buffer to buffer the Event information being collected.  There are three values for this option; NONE, PER_NODE, and PER_CPU.

NONE

The NONE value specifies that a single set of memory buffers will be created for the Event Session.  In this configuration, three memory buffers are created for the Event Session, and the memory for the Event Session is divided evenly, to the nearest 64KB boundary, amongst the three memory buffers.  This is the default value for an Event Session if the MEMORY_PARTITION_MODE is not explicitly defined.

PER_NODE

The PER_NODE value specifies that a separate set of three memory buffers will be created.  In this configuration, three memory buffers are created for each NUMA node that exists for the SQL Server Instance, and the memory is divided evenly, to the nearest 64KB boundary, amongst all of the memory buffers.

PER_CPU

The PER_CPU value specifies that a set of memory buffers is created for each CPUs/Scheduler that is assigned to the SQL Server Instance.  In this configuration, the number of memory buffers is 2.5 times the number of CPUs/Schedulers available, and the memory is divided evenly, to the nearest 64KB boundary, amongst all of the memory buffers.

STARTUP_STATE

The STARTUP_STATE option specifies whether an Event Session automatically starts in an Active state when the SQL Server Instance starts up.  There are two valid values for this option, ON and OFF, with OFF being the default.

TRACK_CAUSALITY

The TRACK_CAUSALITY option specifies whether causality tracking across multiple Events is turned ON or OFF.  The default configuration for this option is OFF.  When TRACK_CAUSALITY is turned on, an additional Action, package0.attach_activity_id, is added to each Event that fires in the Event Session.  This Action is a combination GUID and sequence number that allows related Events to be tracked for cause and effect analysis of the Events that fired in the order in which they have fired.

I should make note of the fact that in many cases, the options specified in the blog posts, may not be appropriate for a production implementation, and may have been made based on the fact that I just didn’t want to wait over multiple test cycles for Events to dispatch to the Targets.
Tracking Page Splits in SQL Server Denali CTP1
http://www.sqlskills.com/blogs/jonathan/an-xevent-a-day-27-of-31-the-future-tracking-page-splits-in-sql-server-denali-ctp1/
在sql2012里跟踪页面拆分
Nearly two years ago Kalen Delaney blogged about Splitting a page into multiple pages, showing how page splits occur inside of SQL Server.  Following her blog post, Michael Zilberstein wrote a post, Monitoring Page Splits with Extended Events, that showed how to see the sqlserver.page_split Events using Extended Events.  Eladio Rincón also blogged about Using XEvents (Extended Events) in SQL Server 2008 to detect which queries are causing Page Splits, but not in relation to Kalen’s blog post.  Both of these blog posts demonstrate how to get the sqlserver.page_split Events, but as discussed in the comments section of Michael Zilberstein’s blog post, the Event fires for all page splits and Adam Machanic and I talked after Eladio’s blog post and opened a connect item to have the sqlserver.page_split Event extended in the product so that you know what kind of split is actually occurring.

https://connect.microsoft.com/SQLServer/feedback/details/388482/sql-server-extended-events-page-split-event-additions

The CTP1 release of Denali has significant changes to the sqlserver.page_split Event, that makes it easier to find the splitting object as well the type of split that is occurring.  Before we look at that, I am going to show the code required to get the object and index information from SQL Server 2008, which is based on Adam’s comments to use sys.dm_os_buffer_descriptors.  For the examples in this blog post I am going use Kalen’s multipage split example from her blog post referenced above.

    -- Create the table
    USE tempdb;
    GO
    SET NOCOUNT ON
    GO
    IF EXISTS (SELECT * FROM sys.tables
                WHERE name = 'split_page')
        DROP TABLE split_page;
    GO
    CREATE TABLE split_page
    (id INT IDENTITY(0,2) PRIMARY KEY,
    id2 bigint DEFAULT 0,
    data1 VARCHAR(33) NULL,
    data2 VARCHAR(8000) NULL);
    GO
    -- fill page until no more rows fit
    INSERT INTO split_page DEFAULT VALUES;
    GO 385
    -- verify that there is only one data page
    DBCC IND(tempdb, split_page, -1);
    -- Create MonitorPageSplits Extended Event Session
    IF (SELECT 1 FROM sys.server_event_sessions WHERE name = 'MonitorPageSplits') IS NOT NULL
       DROP EVENT SESSION MonitorPageSplits ON SERVER
    GO
    CREATE EVENT SESSION MonitorPageSplits ON SERVER
    ADD EVENT sqlserver.page_split
    (
        ACTION (sqlserver.database_id, sqlserver.sql_text)
        WHERE sqlserver.database_id = 2
    )
    ADD TARGET package0.ring_buffer
    WITH(MAX_DISPATCH_LATENCY = 1 SECONDS)
    GO
    -- Start the MonitorPageSplits Event Session
    ALTER EVENT SESSION MonitorPageSplits ON SERVER STATE = start;
    GO
    -- Now insert one more row, this time filling the VARCHARs to the maximum length.
    SET IDENTITY_INSERT split_page  ON;
    GO
    INSERT INTO split_page (id, id2, data1, data2)
          SELECT 111, 0, REPLICATE('a', 33), REPLICATE('b', 8000);
    GO
    SET IDENTITY_INSERT split_page  OFF;
    GO
    ALTER EVENT SESSION MonitorPageSplits ON SERVER
    DROP EVENT sqlserver.page_split;
    GO
    -- Wait to allow dispatch to complete
    WAITFOR DELAY '00:00:01.000'
    GO
    SELECT oTab.*
      , p.OBJECT_ID
      , p.index_id
      , OBJECT_NAME(p.OBJECT_ID)
      , i.name
    FROM
    (
    SELECT
        XEvent            = XEvent.query('.')
      , time              = XEvent.value('(@timestamp)[1]','datetime')
      , FILE_ID           = XEvent.value('(data[@name=''file_id'']/value)[1]','int')
      , page_id           = XEvent.value('(data[@name=''page_id'']/value)[1]','int')
      , database_id       = XEvent.value('(action[@name=''database_id'']/value)[1]','int')
      , sql_text          = XEvent.value('(action[@name=''sql_text'']/value)[1]','varchar(max)')
    FROM
    (
       SELECT CAST(target_data AS XML) AS target_data
       FROM sys.dm_xe_session_targets xst
       JOIN sys.dm_xe_sessions xs ON xs.address = xst.event_session_address
       WHERE xs.name = 'MonitorPageSplits'
    ) AS tab (target_data)
    CROSS APPLY target_data.nodes('/RingBufferTarget/event') AS EventNodes(XEvent)
    ) AS oTab
    LEFT JOIN sys.dm_os_buffer_descriptors AS obd
       ON obd.database_id = oTab.database_id
           AND obd.FILE_ID = oTab.FILE_ID
           AND obd.page_id = oTab.page_id
    LEFT JOIN sys.allocation_units au
       ON au.allocation_unit_id = obd.allocation_unit_id
    LEFT JOIN sys.partitions p
       ON p.partition_id = au.container_id
    LEFT JOIN sys.indexes i
       ON p.OBJECT_ID = i.OBJECT_ID
           AND p.index_id = i.index_id
    -- verify that there is only one data page
    DBCC IND(tempdb, split_page, -1);


The above code creates a table in tempdb, loads one page of data in it exactly as in Kalen’s blog post, and then creates an Event Session for the sqlserver.page_split Event in tempdb, that also collects the sqlserver.database_id and sqlserver.sql_text actions when the Event fires.  After triggering the page split, it drops the Event from the Event Session and then uses WAITFOR DELAY to allow the events to be buffered to the package0.ring_buffer Target.  Then it shreds the XML and joins to the DMV’s to get the object and index names.  The output of running the above script in SQL Server 2008 should be similar to the following, showing 10 split events and 10 additional pages in the database table.

 An XEvent a Day (27 of 31)   The Future   Tracking Page Splits in SQL Server Denali CTP1   image thumb  .

Note that the only two columns returned by the sqlserver.page_split Event are the file_id and page_id.  In SQL Server Denali CTP1, the sqlserver.page_split event now has a much larger Event payload associated with it.  It now returns the file_id, page_id, database_id (as a part of the event, not requiring an action), rowset_id, splitOperation, new_page_file_id, and the new_page_page_id associated with the page_split Event.   This makes the Event much more useful and allows it to be used without having to query the buffer descriptors to find the object association.  The following demo is identical to the demo for SQL Server 2008 listed above with the exception of that the XQuery is slightly different (a requirement to pull the new information from the XML).

    -- Create the table
    USE tempdb;
    GO
    SET NOCOUNT ON
    GO
    IF EXISTS (SELECT * FROM sys.tables
                WHERE name = 'split_page')
        DROP TABLE split_page;
    GO
    CREATE TABLE split_page
    (id INT IDENTITY(0,2) PRIMARY KEY,
    id2 bigint DEFAULT 0,
    data1 VARCHAR(33) NULL,
    data2 VARCHAR(8000) NULL);
    GO
    -- fill page until no more rows fit
    INSERT INTO split_page DEFAULT VALUES;
    GO 385
    -- verify that there is only one data page
    DBCC IND(tempdb, split_page, -1);
    -- Create MonitorPageSplits Extended Event Session
    IF (SELECT 1 FROM sys.server_event_sessions WHERE name = 'MonitorPageSplits') IS NOT NULL
       DROP EVENT SESSION MonitorPageSplits ON SERVER
    GO
    CREATE EVENT SESSION MonitorPageSplits ON SERVER
    ADD EVENT sqlserver.page_split
    (
        ACTION (sqlserver.database_id, sqlserver.sql_text)
        WHERE sqlserver.database_id = 2
    )
    ADD TARGET package0.ring_buffer
    WITH (MAX_DISPATCH_LATENCY = 1 SECONDS)
    GO
    -- Start the MonitorPageSplits Event Session
    ALTER EVENT SESSION MonitorPageSplits ON SERVER STATE = start;
    GO
    -- Now insert one more row, this time filling the VARCHARs to the maximum length.
    SET IDENTITY_INSERT split_page  ON;
    GO
    INSERT INTO split_page (id, id2, data1, data2)
          SELECT 111, 0, REPLICATE('a', 33), REPLICATE('b', 8000);
    GO
    SET IDENTITY_INSERT split_page  OFF;
    GO
    ALTER EVENT SESSION MonitorPageSplits ON SERVER
    DROP EVENT sqlserver.page_split;

    GO
    SELECT
        event_time         = XEvent.value('(@timestamp)[1]','datetime')
      , orig_file_id      = XEvent.value('(data[@name=''file_id'']/value)[1]','int')
      , orig_page_id      = XEvent.value('(data[@name=''page_id'']/value)[1]','int')
      , database_id           = XEvent.value('(data[@name=''database_id'']/value)[1]','int')
      , OBJECT_ID         = p.OBJECT_ID
      , index_id          = p.index_id
      , OBJECT_NAME           = OBJECT_NAME(p.OBJECT_ID)
      , index_name            = i.name
      , rowset_id         = XEvent.value('(data[@name=''rowset_id'']/value)[1]','bigint')
      , splitOperation        = XEvent.value('(data[@name=''splitOperation'']/text)[1]','varchar(255)')
      , new_page_file_id  = XEvent.value('(data[@name=''new_page_file_id'']/value)[1]','int')
      , new_page_page_id  = XEvent.value('(data[@name=''new_page_page_id'']/value)[1]','int')
      , sql_text          = XEvent.value('(action[@name=''sql_text'']/value)[1]','varchar(max)')
    FROM
    (
       SELECT CAST(target_data AS XML) AS target_data
       FROM sys.dm_xe_session_targets xst
       JOIN sys.dm_xe_sessions xs ON xs.address = xst.event_session_address
       WHERE xs.name = 'MonitorPageSplits'
    ) AS tab (target_data)
    CROSS APPLY target_data.nodes('/RingBufferTarget/event') AS EventNodes(XEvent)
    LEFT JOIN sys.allocation_units au
       ON au.container_id = XEvent.value('(data[@name=''rowset_id'']/value)[1]','bigint')
    LEFT JOIN sys.partitions p
       ON p.partition_id = au.container_id
    LEFT JOIN sys.indexes i
       ON p.OBJECT_ID = i.OBJECT_ID
           AND p.index_id = i.index_id
    -- View the Page allocations
    DBCC IND(tempdb, split_page, -1);

If you run the above demo the output should be similar to the below (if you click on the picture, it will open up larger).  One thing that should become immediately obvious is that the same demo in Denali is doing 1/3rd of the page splits that occur in SQL Server 2008.

An XEvent a Day (27 of 31)   The Future   Tracking Page Splits in SQL Server Denali CTP1   image3 thumb

The old_page_id and new_page_id tell where the page originated and moved to, and the splitOperation tells the type of split.  In this case only two of the type of splits are occurring; SPLIT_FOR_ROOT_NODE which occurs when the first page allocated is split into multiple pages, and SPLIT_FOR_INSERT which occurs as the inserts continue and the pages are split to accommodate the data.  There are a number of additional split operations that exist in SQL Server Denali CTP1 including, SPLIT_FOR_DELETE, SPLIT_FOR_GHOST, SPLIT_FOR_INTERNAL_NODE, and SPLIT_FOR_UPDATE.  I’ve tried to figure out how to correlate the output from DBCC IND with the data held in the Event Session for page splits to correlate the old_page_id and new_page_id to identify problematic splits, but haven’t finalized validation of my tests yet (hopefully I can finish this work and I’ll write an update to this blog post showing how to do this at some point in the near future).  One item that I have noted in my testing is that mid-page splits generally generate multiple sqlserver.page_split Events in the same operation, similar to the demonstrations used in this example, where as end-page splits for identity and sequential GUID inserts do not.  I am not certain that this is a valid conclusion to come to at this point and have further testing to do to investigate page splits more.
Tracking Page Compression Operations
http://www.sqlskills.com/blogs/jonathan/an-xevent-a-day-28-of-31-tracking-page-compression-operations/
跟踪页面压缩操作
sqlserver.page_compression_attempt_failed
sqlserver.page_compression_tracing
页面压缩事件 跟踪压缩级别:数据库,对象,索引,页面
The Database Compression feature in SQL Server 2008 Enterprise Edition can provide some significant reductions in storage requirements for SQL Server databases, and in the right implementations and scenarios performance improvements as well.  There isn’t really a whole lot of information about the operations of database compression that is documented as being available in the DMV’s or SQL Trace.  Paul Randal pointed out on Twitter today that sys.dm_db_index_operational_stats() provides the page_compression_attempt_count and page_compression_success_count available.  Beyond that the only other documented information for monitoring Data Compression are the Page Compression Attempts/sec and Pages Compressed/sec Performance Counters of the SQL Server:Access Methods object in Perfmon (http://msdn.microsoft.com/en-us/library/cc280449.aspx).

There is one thing in common about the documented methods of monitoring Data Compression, and that is they all only deal with Page compression, and not Row compression, and in Extended Events we find the same commonality as there are no Row compression Events in Extended Events.  There are two Page compression Events in Extended Events; sqlserver.page_compression_attempt_failed and sqlserver.page_compression_tracing.  These two Events can be used to track Page compression operations at multiple levels, including database, object, index, and even down to the individual page. The sqlserver.page_compression_tracing Event provides Start and End tracing of Page compression operations inside of the Database Engine and returns the database_id, index_id, rowset_id, page_id, and duration of the compression operation.  The sqlserver.page_compression_attempt_failed is really poorly named, and doesn’t provide information about failures in the sense that something broke, but provides information for why a page compression attempt did not actually change the compression of the data in the page.  It also returns the database_id, index_id, rowset_id, and page_id for the compression attempt, and it also includes a failure_reason column which correlates to the page_compression_failure_reason Map Value.

-- Get the payload information for the Events
SELECT
    object_name,
    column_id,
    name,
    type_name
FROM sys.dm_xe_object_columns
WHERE object_name IN ('page_compression_tracing',
                      'page_compression_attempt_failed')
  AND column_type = 'data'
An XEvent a Day (28 of 31)   Tracking Page Compression Operations   image thumb

To demonstrate how these Events function, I am going to use the LineItem table from the TPC-H Benchmark that was created by Quest Benchmark Factory using Level 2 for the table sizing, which makes the table just at 1.8GB in size.  All of the indexes on the table will be rebuilt using PAGE compression, and then 10,000 rows will be added to the table.  To setup the environment, first load the TPC-H LineItem table with the appropriate seed of data, this can be done with the free trial version of Benchmark Factory.  Then rebuild all of the indexes on the LineItem table using PAGE compression, and review the PAGE compression statistics from sys.dm_db_index_operational_stats for the database and object.

USE [TPCH]
GO
-- Rebuild the indexes with Page compression
ALTER INDEX ALL ON dbo.H_Lineitem REBUILD WITH (DATA_COMPRESSION = PAGE)
GO
-- Look at the compression information in sys.dm_db_index_operational_stats
SELECT
    database_id,
    object_id,
    index_id,
    page_compression_attempt_count,
    page_compression_success_count,
    (page_compression_attempt_count - page_compression_success_count) as page_compression_failure_count
FROM sys.dm_db_index_operational_stats(db_id('TPCH'), object_id('H_Lineitem'), null, null)
GO
An XEvent a Day (28 of 31)   Tracking Page Compression Operations   image thumb

Once the table and its indexes have been rebuilt using PAGE compression, we can then create our Event Session, start it, and add 10,000 rows to the LineItem table.  After we add the rows, we can then check the page compression statistics in sys.dm_db_index_operational_stats, and drop our Event Session from the server.

-- Create an Event Session to Track the Failed attempts
CREATE EVENT SESSION PageCompressionTracing
ON SERVER
ADD EVENT sqlserver.page_compression_attempt_failed,
ADD EVENT sqlserver.page_compression_tracing
ADD TARGET package0.asynchronous_file_target(
     SET filename='C:\SQLBlog\PageCompressionTracing.xel',
         metadatafile='C:\SQLBlog\PageCompressionTracing.xem')
WITH (MAX_MEMORY = 8MB, EVENT_RETENTION_MODE = ALLOW_SINGLE_EVENT_LOSS, MAX_DISPATCH_LATENCY=5SECONDS)
GO
-- Start the Event Session
ALTER EVENT SESSION PageCompressionTracing
ON SERVER
STATE=START
GO
-- Insert 10000 rows into the H_Lineitem table
INSERT INTO H_Lineitem
    (l_orderkey, l_partkey, l_suppkey, l_linenumber, l_quantity,
     l_extendedprice, l_discount, l_tax, l_returnflag, l_linestatus,
     l_shipdate, l_commitdate, l_receiptdate, l_shipinstruct, l_shipmode,
     l_comment)
SELECT TOP 10000
     l_orderkey, l_partkey, l_suppkey, l_linenumber, l_quantity,
     l_extendedprice, l_discount, l_tax, l_returnflag, l_linestatus,
     l_shipdate, l_commitdate, l_receiptdate, l_shipinstruct, l_shipmode,
     l_comment
FROM H_Lineitem
GO
-- Look at the compression information in sys.dm_db_index_operational_stats
SELECT
    database_id,
    object_id,
    index_id,
    page_compression_attempt_count,
    page_compression_success_count,
    (page_compression_attempt_count - page_compression_success_count) as page_compression_failure_count
FROM sys.dm_db_index_operational_stats(db_id('TPCH'), object_id('H_Lineitem'), null, null)
GO
-- Drop the Event Session
DROP EVENT SESSION PageCompressionTracing
ON SERVER
GO
An XEvent a Day (28 of 31)   Tracking Page Compression Operations   image thumb

Now we can parse the Events that were captured by our Event Session and compare the information presented by sys.dm_db_index_operational_stats() with what was collected by Extended Events.

-- Create our result Analysis database
CREATE DATABASE [PageCompTestResults]
GO
USE [PageCompTestResults]
GO
-- Create intermediate temp table for raw event data
CREATE TABLE RawEventData
(Rowid int identity primary key, event_data xml)
GO
-- Read the file data into intermediate temp table
INSERT INTO RawEventData (event_data)
SELECT
    CAST(event_data AS XML) AS event_data
FROM sys.fn_xe_file_target_read_file('C:\SQLBlog\PageCompressionTracing*.xel',
                                     'C:\SQLBlog\PageCompressionTracing*.xem',
                                     null, null)
GO
-- Fetch the Event Data from the Event Session Target
SELECT
    RowID,
    event_data.value('(event/@name)[1]', 'varchar(50)') AS event_name,
    DATEADD(hh,
            DATEDIFF(hh, GETUTCDATE(), CURRENT_TIMESTAMP),
            event_data.value('(event/@timestamp)[1]', 'datetime2')) AS [timestamp],
    COALESCE(event_data.value('(event/data[@name="database_id"]/value)[1]', 'int'),
             event_data.value('(event/action[@name="database_id"]/value)[1]', 'int')) AS database_id,
    event_data.value('(event/data[@name="file_id"]/value)[1]', 'int') AS [file_id],
    event_data.value('(event/data[@name="page_id"]/value)[1]', 'int') AS [page_id],
    event_data.value('(event/data[@name="rowset_id"]/value)[1]', 'bigint') AS [rowset_id],
    event_data.value('(event/data[@name="failure_reason"]/text)[1]', 'nvarchar(150)') AS [failure_reason],
    event_data.value('(event/action[@name="system_thread_id"]/value)[1]', 'int') AS [system_thread_id],
    event_data.value('(event/action[@name="scheduler_id"]/value)[1]', 'int') AS [scheduler_id],
    event_data.value('(event/action[@name="cpu_id"]/value)[1]', 'int') AS [cpu_id]
INTO ParsedResults
FROM RawEventData
GO
After parsing out the data, we can begin to really leverage the information we’ve gathered.  If we join the ParsedResults table to sys.partitions for our TPCH database by rowset_id = hobt_id, we can get the object_id and index_id and aggregate the failure reasons up to the object and index level.

SELECT
    pr.database_id,
    p.object_id,
    p.index_id,
    failure_reason,
    COUNT(*) as failure_count
FROM TPCH.sys.partitions p
JOIN ParsedResults pr
    ON pr.rowset_id = p.hobt_id
WHERE event_name = 'page_compression_attempt_failed'
GROUP BY     pr.database_id,
    p.object_id,
    p.index_id,
    failure_reason
GO
-- Look at the compression information in sys.dm_db_index_operational_stats
SELECT
    database_id,
    object_id,
    index_id,
    page_compression_attempt_count,
    page_compression_success_count,
    (page_compression_attempt_count - page_compression_success_count) as page_compression_failure_count
FROM sys.dm_db_index_operational_stats(db_id('TPCH'), object_id('H_Lineitem'), null, null)
GO
An XEvent a Day (28 of 31)   Tracking Page Compression Operations   image thumb

With this we can se that the Extended Events sqlserver.page_compression_attempt_failed Event tracks failures and attempts that are not counted in sys.dm_db_index_operational_stats().  The PageModCountBelowThreshold failure isn’t really a failed attempt at compression.  This reason shows that the page was evaluated for recalculation, and the modified counter for the page hadn’t passed the internal threshold for recalculation so the actual compression operation wasn’t performed.  If we look at the sqlserver.page_compression_tracing Event information, we can see how the numbers begin to come together to match what is output by sys.dm_db_index_operational_stats().

SELECT
    pr.database_id,
    p.object_id,
    p.index_id,
    COUNT(*) as attempt_count
FROM TPCH.sys.partitions p
JOIN ParsedResults pr
    ON pr.rowset_id = p.hobt_id
WHERE event_name = 'page_compression_tracing'
  AND opcode = 'Begin'
GROUP BY     pr.database_id,
    p.object_id,
    p.index_id
GO
-- Look at the compression information in sys.dm_db_index_operational_stats
SELECT
    database_id,
    object_id,
    index_id,
    page_compression_attempt_count,
    page_compression_success_count,
    (page_compression_attempt_count - page_compression_success_count) as page_compression_failure_count
FROM sys.dm_db_index_operational_stats(db_id('TPCH'), object_id('H_Lineitem'), null, null)
GO
An XEvent a Day (28 of 31)   Tracking Page Compression Operations   image thumb

We have 193 attempts by this Event, and we have 72 PageModCountBelowThreshold failures, matching our actual attempts of 121 from the DMF.  We can then subtract out the other failures and get the 93 successful operations matching the DMF as well.
Looking at Database Startup in Denali
http://www.sqlskills.com/blogs/jonathan/an-xevent-a-day-29-of-31-the-future-looking-at-database-startup-in-denali/
在sql2012里面查看数据库启动过程
As I have said previously in this series, one of my favorite aspects of Extended Events is that it allows you to look at what is going on under the covers in SQL Server, at a level that has never previously been possible.  SQL Server Denali CTP1 includes a number of new Events that expand on the information that we can learn about how SQL Server operates and in today’s blog post we’ll look at how we can use those Events to look at what happens when a database starts up inside of SQL Server.

First lets create our Event Session, which will collect a large number of events that relate to the operations that occur when a database starts in SQL Server.

DECLARE @sqlcmd nvarchar(max) =
'IF EXISTS(SELECT * FROM sys.server_event_sessions WHERE
name=''MonitorStartupLogRecovery'')
   DROP EVENT SESSION [MonitorStartupLogRecovery] ON SERVER;
CREATE EVENT SESSION [MonitorStartupLogRecovery]
ON SERVER
ADD EVENT sqlserver.database_started
(WHERE (database_id = ' + CAST(DB_ID('AdventureWorks2008R2') AS varchar(3)) + ')),
ADD EVENT sqlserver.databases_log_file_used_size_changed
(WHERE (database_id = ' + CAST(DB_ID('AdventureWorks2008R2') AS varchar(3)) + ')),
ADD EVENT sqlserver.databases_log_flush
(WHERE (database_id = ' + CAST(DB_ID('AdventureWorks2008R2') AS varchar(3)) + ')),
ADD EVENT sqlserver.databases_log_flush_wait
(WHERE (database_id = ' + CAST(DB_ID('AdventureWorks2008R2') AS varchar(3)) + ')),
ADD EVENT sqlserver.file_read
(WHERE (database_id = ' + CAST(DB_ID('AdventureWorks2008R2') AS varchar(3)) + ')),
ADD EVENT sqlserver.file_read_completed
(WHERE (database_id = ' + CAST(DB_ID('AdventureWorks2008R2') AS varchar(3)) + ')),
ADD EVENT sqlserver.file_write_completed
(WHERE (database_id = ' + CAST(DB_ID('AdventureWorks2008R2') AS varchar(3)) + ')),
ADD EVENT sqlserver.file_written
(WHERE (database_id = ' + CAST(DB_ID('AdventureWorks2008R2') AS varchar(3)) + ')),
ADD EVENT sqlserver.log_block_cache
(WHERE (database_id = ' + CAST(DB_ID('AdventureWorks2008R2') AS varchar(3)) + ')),
ADD EVENT sqlserver.log_block_consume
(WHERE (database_id = ' + CAST(DB_ID('AdventureWorks2008R2') AS varchar(3)) + ')),
ADD EVENT sqlserver.log_blocks_uncache
(WHERE (database_id = ' + CAST(DB_ID('AdventureWorks2008R2') AS varchar(3)) + ')),
ADD EVENT sqlserver.log_cache_buffer_refcounter_change
(WHERE (database_id = ' + CAST(DB_ID('AdventureWorks2008R2') AS varchar(3)) + ')),
ADD EVENT sqlserver.log_consumer_act
(WHERE (database_id = ' + CAST(DB_ID('AdventureWorks2008R2') AS varchar(3)) + ')),
ADD EVENT sqlserver.log_flush_complete
(WHERE (database_id = ' + CAST(DB_ID('AdventureWorks2008R2') AS varchar(3)) + ')),
ADD EVENT sqlserver.log_flush_requested
(WHERE (database_id = ' + CAST(DB_ID('AdventureWorks2008R2') AS varchar(3)) + ')),
ADD EVENT sqlserver.log_flush_start
(WHERE (database_id = ' + CAST(DB_ID('AdventureWorks2008R2') AS varchar(3)) + ')),
ADD EVENT sqlserver.log_single_record
(WHERE (database_id = ' + CAST(DB_ID('AdventureWorks2008R2') AS varchar(3)) + ')),
ADD EVENT sqlserver.new_log_interest_flip
(WHERE (database_id = ' + CAST(DB_ID('AdventureWorks2008R2') AS varchar(3)) + ')),
ADD EVENT sqlserver.redo_single_record
(WHERE (database_id = ' + CAST(DB_ID('AdventureWorks2008R2') AS varchar(3)) + ')),
ADD EVENT sqlserver.redo_target_set
(WHERE (database_id = ' + CAST(DB_ID('AdventureWorks2008R2') AS varchar(3)) + ')),
ADD EVENT sqlserver.transaction_log
(WHERE (database_id = ' + CAST(DB_ID('AdventureWorks2008R2') AS varchar(3)) + '))
ADD TARGET package0.asynchronous_file_target(
     SET filename=''C:\SQLBlog\MonitorStartupLogRecovery.xel'',
         metadatafile=''C:\SQLBlog\MonitorStartupLogRecovery.xem'')
WITH (MAX_MEMORY = 8192KB, EVENT_RETENTION_MODE = ALLOW_SINGLE_EVENT_LOSS, STARTUP_STATE = ON)'
EXEC(@sqlcmd)
GO
With the Event Session created, we can make some changes that write to our test database to see what happens when the database is recovered at startup. We are going to can make two changes to the database.  First we’ll begin a transaction and create a table with 10 rows of data in it without committing the transaction.

USE AdventureWorks2008R2
GO
-- Begin a Transaction and leave it open
BEGIN TRANSACTION
-- Create the First Table
SELECT TOP 10 *
INTO TestTable
FROM Sales.SalesOrderDetail sod
GO
Now in a New Query Window, we’ll create a second table with 10 rows of data without opening a transaction, and then force a dirty shutdown of the Database Engine.

USE AdventureWorks2008R2
GO
-- Create a Second Table
SELECT TOP 10 *
INTO TestTable2
FROM Sales.SalesOrderDetail sod
GO
-- Flush changes to data file
CHECKPOINT
GO
-- Force Shutdown the Engine
SHUTDOWN
Once SHUTDOWN is issued, the process terminates, and the Database Engine will need to be restarted from the Services Snapin, the SQL Server Configuration Manager, or through SSMS.  When the Engine starts up, the Event Session will become active, and the Events will be logged to the package0.asynchronous_file_target for analysis.  Once recovery completes, we can drop the Event Session from the Server, so that the buffers flush, and we can then begin our analysis of the collected information.

USE tempdb
GO

-- Read the Raw Event data into a table
SELECT CAST(event_data AS XML) AS event_data
INTO TargetEvents
FROM sys.fn_xe_file_target_read_file('C:\SQLBlog\MonitorStartupLogRecovery*.xel', 'C:\SQLBlog\MonitorStartupLogRecovery*.xem', null, null)

-- Fetch the Event Data from the Raw Event Data into another table
SELECT
    event_data.value('(event/@name)[1]', 'varchar(50)') AS event_name,
    DATEADD(hh,
            DATEDIFF(hh, GETUTCDATE(), CURRENT_TIMESTAMP),
            event_data.value('(event/@timestamp)[1]', 'datetime2')) AS [timestamp],
    COALESCE(event_data.value('(event/data[@name="database_id"]/value)[1]', 'int'),
             event_data.value('(event/action[@name="database_id"]/value)[1]', 'int')) AS database_id,
    event_data.value('(event/data[@name="count"]/value)[1]', 'bigint') AS [count],
    event_data.value('(event/data[@name="start_log_block_id"]/value)[1]', 'bigint') AS [start_log_block_id],
    event_data.value('(event/data[@name="is_read_ahead"]/value)[1]', 'nvarchar(4000)') AS [is_read_ahead],
    event_data.value('(event/data[@name="private_consumer_id"]/value)[1]', 'bigint') AS [private_consumer_id],
    event_data.value('(event/data[@name="mode"]/text)[1]', 'nvarchar(4000)') AS [mode],
    event_data.value('(event/data[@name="file_handle"]/value)[1]', 'nvarchar(4000)') AS [file_handle],
    event_data.value('(event/data[@name="offset"]/value)[1]', 'bigint') AS [offset],
    event_data.value('(event/data[@name="file_id"]/value)[1]', 'int') AS [file_id],
    event_data.value('(event/data[@name="filegroup_id"]/value)[1]', 'int') AS [filegroup_id],
    event_data.value('(event/data[@name="size"]/value)[1]', 'bigint') AS [size],
    event_data.value('(event/data[@name="path"]/value)[1]', 'nvarchar(4000)') AS [path],
    event_data.value('(event/data[@name="duration"]/value)[1]', 'bigint') AS [duration],
    event_data.value('(event/data[@name="io_data"]/value)[1]', 'nvarchar(4000)') AS [io_data],
    event_data.value('(event/data[@name="resource_type"]/text)[1]', 'nvarchar(4000)') AS [resource_type],
    event_data.value('(event/data[@name="owner_type"]/text)[1]', 'nvarchar(4000)') AS [owner_type],
    event_data.value('(event/data[@name="transaction_id"]/value)[1]', 'bigint') AS [transaction_id],
    event_data.value('(event/data[@name="lockspace_workspace_id"]/value)[1]', 'nvarchar(4000)') AS [lockspace_workspace_id],
    event_data.value('(event/data[@name="lockspace_sub_id"]/value)[1]', 'int') AS [lockspace_sub_id],
    event_data.value('(event/data[@name="lockspace_nest_id"]/value)[1]', 'int') AS [lockspace_nest_id],
    event_data.value('(event/data[@name="resource_0"]/value)[1]', 'int') AS [resource_0],
    event_data.value('(event/data[@name="resource_1"]/value)[1]', 'int') AS [resource_1],
    event_data.value('(event/data[@name="resource_2"]/value)[1]', 'int') AS [resource_2],
    event_data.value('(event/data[@name="object_id"]/value)[1]', 'int') AS [object_id],
    event_data.value('(event/data[@name="associated_object_id"]/value)[1]', 'bigint') AS [associated_object_id],
    event_data.value('(event/data[@name="resource_description"]/value)[1]', 'nvarchar(4000)') AS [resource_description],
    event_data.value('(event/data[@name="database_name"]/value)[1]', 'nvarchar(4000)') AS [database_name],
    event_data.value('(event/data[@name="log_block_id"]/value)[1]', 'bigint') AS [log_block_id],
    event_data.value('(event/data[@name="log_block_size"]/value)[1]', 'int') AS [log_block_size],
    event_data.value('(event/data[@name="from_disk"]/value)[1]', 'nvarchar(4000)') AS [from_disk],
    event_data.value('(event/data[@name="incomplete"]/value)[1]', 'nvarchar(4000)') AS [incomplete],
    event_data.value('(event/data[@name="cache_buffer_pointer"]/value)[1]', 'nvarchar(4000)') AS [cache_buffer_pointer],
    event_data.value('(event/data[@name="consumer_id"]/value)[1]', 'bigint') AS [consumer_id],
    event_data.value('(event/data[@name="old_weight"]/value)[1]', 'int') AS [old_weight],
    event_data.value('(event/data[@name="new_weight"]/value)[1]', 'int') AS [new_weight],
    event_data.value('(event/data[@name="new_position"]/value)[1]', 'int') AS [new_position],
    event_data.value('(event/data[@name="last_log_block_id"]/value)[1]', 'bigint') AS [last_log_block_id],
    event_data.value('(event/data[@name="weight"]/value)[1]', 'int') AS [weight],
    event_data.value('(event/data[@name="address"]/value)[1]', 'nvarchar(4000)') AS [address],
    event_data.value('(event/data[@name="type"]/text)[1]', 'nvarchar(4000)') AS [type],
    event_data.value('(event/data[@name="current_count"]/value)[1]', 'int') AS [current_count],
    event_data.value('(event/data[@name="change_type"]/value)[1]', 'int') AS [change_type],
    event_data.value('(event/data[@name="activity_id"]/value)[1]', 'int') AS [activity_id],
    event_data.value('(event/data[@name="write_size"]/value)[1]', 'int') AS [write_size],
    event_data.value('(event/data[@name="rows"]/value)[1]', 'int') AS [rows],
    event_data.value('(event/data[@name="pending_writes"]/value)[1]', 'int') AS [pending_writes],
    event_data.value('(event/data[@name="pending_bytes"]/value)[1]', 'int') AS [pending_bytes],
    event_data.value('(event/data[@name="reason"]/text)[1]', 'nvarchar(4000)') AS [reason],
    event_data.value('(event/data[@name="waiters"]/value)[1]', 'int') AS [waiters],
    event_data.value('(event/data[@name="error"]/value)[1]', 'int') AS [error],
    event_data.value('(event/data[@name="slot_id"]/value)[1]', 'int') AS [slot_id],
    event_data.value('(event/data[@name="used_size"]/value)[1]', 'int') AS [used_size],
    event_data.value('(event/data[@name="reservation_size"]/value)[1]', 'bigint') AS [reservation_size],
    event_data.value('(event/data[@name="log_op_id"]/value)[1]', 'int') AS [log_op_id],
    event_data.value('(event/data[@name="log_op_name"]/value)[1]', 'nvarchar(4000)') AS [log_op_name],
    event_data.value('(event/data[@name="interest"]/value)[1]', 'nvarchar(4000)') AS [interest],
    event_data.value('(event/data[@name="cache_type"]/value)[1]', 'int') AS [cache_type],
    event_data.value('(event/data[@name="keys"]/value)[1]', 'nvarchar(4000)') AS [keys],
    event_data.value('(event/data[@name="stop_mark"]/value)[1]', 'nvarchar(4000)') AS [stop_mark],
    event_data.value('(event/data[@name="operation"]/text)[1]', 'nvarchar(4000)') AS [operation],
    event_data.value('(event/data[@name="success"]/value)[1]', 'nvarchar(4000)') AS [success],
    event_data.value('(event/data[@name="index_id"]/value)[1]', 'int') AS [index_id],
    event_data.value('(event/data[@name="log_record_size"]/value)[1]', 'int') AS [log_record_size],
    event_data.value('(event/data[@name="context"]/text)[1]', 'nvarchar(4000)') AS [context],
    event_data.value('(event/data[@name="replication_command"]/value)[1]', 'int') AS [replication_command],
    event_data.value('(event/data[@name="transaction_start_time"]/value)[1]', 'nvarchar(4000)') AS [transaction_start_time]
INTO Results
FROM TargetEvents
Now we can begin to analyze the information that we collected by querying the Results table.  Looking at the Results as a whole, we can see the database opened by reading the first page of the database and then the database boot page (page_id=9) and page 32 of the primary data file.  Then the engine scans each of the VLF’s of the transaction log.  We can tell that the log reads are scans of the VLF’s by looking at the DBCC LOGINFO information for the database and comparing the file_read offsets from the Event Session to the StartOffset of each of the VLF’s in the DBCC LOGINFO output.

DBCC LOGINFO
An XEvent a Day (29 of 31)   The Future   Looking at Database Startup in Denali   image thumb

SELECT event_name, timestamp, database_id, file_id, mode, offset,
    CASE WHEN file_id = 1 THEN offset/8192 ELSE NULL END AS page_id, size,
    log_block_id, log_block_size, start_log_block_id, last_log_block_id,
    from_disk, consumer_id, activity_id, log_op_id, log_op_name, change_type,
    operation, object_id, index_id, log_record_size, slot_id, used_size,
    reservation_size, write_size, rows, pending_writes, pending_bytes,
    context, waiters
FROM Results
An XEvent a Day (29 of 31)   The Future   Looking at Database Startup in Denali   image thumb

After the startup scans the VLF’s 120K of information is read from the log file, and the log buffers start to be consumed to determine the redo start point for recovery.  We can filter our Event data to remove Events that while interesting are not necessary for our analysis at the moment, as well as to reduce the number of columns being returned from the data set.

SELECT
    event_name, timestamp, file_id, mode, offset, size, log_block_id,
    COALESCE(log_op_name, operation) as [operation], slot_id,
    object_id, index_id, log_record_size, context, write_size, rows
FROM Results
WHERE event_name NOT IN ('log_consumer_act', 'log_single_record', 'log_cache_buffer_refcounter_change', 'file_read')
An XEvent a Day (29 of 31)   The Future   Looking at Database Startup in Denali   image thumb

With the filtered results, we can see the log reads into cache and the setting of the redo target.  If we scroll down further, we can get a better picture of what is happening.

An XEvent a Day (29 of 31)   The Future   Looking at Database Startup in Denali   image thumb

The last active log blog was consumed, and the redo target was set at that log_block_id.  Then the log is reread starting at offset 318976 and the blocks get cached and the redo operations begin against the database.  Scrolling through the results further, we can see that the redo operations continue as the log blocks increase up to the Checkpoint operation that was executed immediately before the Shutdown of the instance occurred, at the log block that was set as the redo target originally.

An XEvent a Day (29 of 31)   The Future   Looking at Database Startup in Denali   image thumb

At this point the data file begins to be read so that the undo operations can be performed before making the database available.

An XEvent a Day (29 of 31)   The Future   Looking at Database Startup in Denali   image thumb

After the undo completes the database_started Event is raised and that database becomes available for use.

An XEvent a Day (29 of 31)   The Future   Looking at Database Startup in Denali   image thumb

To validate that the changes we see occurring after the redo operations and before the database_started Event, we can set the database OFFLINE, recreate our Event Session, and then bring the database back ONLINE again, and then compare the logged Events when no changes have occurred to our original Events when known changes have occurred.  I am not going to do that in this blog post, but will instead leave that up to the reader to investigate on their own.
Tracking Session and Statement Level Waits
http://www.sqlskills.com/blogs/jonathan/an-xevent-a-day-30-of-31-tracking-session-and-statement-level-waits/
跟踪会话和语句级等待
等待事件:
sqlos.wait_info
sqlos.wait_info_external
While attending PASS Summit this year, I got the opportunity to hang out with Brent Ozar (Blog|Twitter) one afternoon while he did some work for Yanni Robel (Blog|Twitter).  After looking at the wait stats information, Brent pointed out some potential problem points, and based on that information I pulled up my code for my PASS session the next day on Wait Statistics and Extended Events and made some changes to one of the demo’s so that the Event Session only focused on those potentially problematic waits that had been identified, and sent Brent the DDL so that he could give Extended Events a shot.  Within a few minutes, we were able track down to the statement level in a couple of stored procedures, the causes of those waits, and after some analysis Brent was able to offer some suggestions to Yanni about how to reduce the waits.

Understanding how SQL Server waits to continue execution can be key to improving performance since time spent waiting is time lost during the execution of a SQL Statement.  I love looking at wait statistics and the chapter that I wrote for SQL Server 2008 Internals and Troubleshooting was SQL Server Waits and Extended Events.  Information about wait statistics has been available in SQL Server for a long time, and many of the vendors that develop monitoring applications for SQL Server have polling methods that query sys.dm_os_waiting_tasks or sys.sysprocesses to capture wait information about the tasks that are currently active in the system.  However one of the shortcomings of a polling method is that it misses a lot of the wait information because it is a point in time snapshot only.  If the polling interval is every second, only the active waits that exist at that second are captured, and any waits that occur between the polling interval is missed.  This information is still accumulated in sys.dm_os_wait_stats, but it is impossible to track it back to the statement level from that DMV.

Extended Events offers us the ability to capture information about waits without missing any of the information.  Already in this series we’ve seen how to use Extended Events with the Bucketizer Target to count the occurrences of waits by type.  This isn’t really a great use of Extended Events since sys.dm_os_wait_stats counts the occurrences of the wait types already, and a differential analysis of the information contained in sys.dm_os_wait_stats can provide this information.  The purpose of that example was to discuss the bug that existed in the RTM release of SQL Server 2008 more than it was to provide a sensible use for the target.  However, if we wanted to break our waits down by database, we could bucket on the database_id, and begin to understand which database had the most waits associated with it, but not by the individual wait type.  To get to that level of information, we need to collect all of the waits and the associated information for them to do further analysis.

There are two Events in Extended Events associated with wait types; sqlos.wait_info and sqlos.wait_info_external.  Looking at the description of the Events in the Metadata DMV’s we can get an idea of when each Event will fire.

SELECT name, description
FROM sys.dm_xe_objects
WHERE name LIKE 'wait_info%'
An XEvent a Day (30 of 31) – Tracking Session and Statement Level Waits   image thumb

The sqlos.wait_info_external Event will fire for wait types that begin with PREEMPTIVE_ in the name, and the sqlos.wait_info Event will fire for the other wait types that occur on the server.  Glenn Alan Berry (Blog|Twitter) has a great script that filters queries sys.dm_os_wait_stats and filters out common waits that are not generally problematic.  You can find his script on his blog post Updated SQL 2005 and 2008 Diagnostic Queries.  You can use this script to identify the most common waits on a server, and then use that information to build an Event Session that captures the session and statement information for those individual wait types.  In SQL Server 2008, there are 484 wait types listed in sys.dm_os_wait_stats and there are 599 map_value’s for the wait_types Map in sys.dm_xe_map_values.  The reason this is different is that the Map was created from the header file for the wait types and there are padded values that exist in the Map that don’t really correspond to wait types that exist in SQL Server.  However, there are also a couple of Maps for the wait_types that don’t match the wait type in sys.dm_os_wait_stats, the most notable being the ASYNC_NETWORK_IO to NETWORK_IO.

To build the Event Session, we just need to query sys.dm_map_values for our wait_types and use the map_key’s in the Predicate definition of the sqlos.wait_info or sqlos.wait_info_external Event as appropriate.  We can also do the same thing to build a generic Event Session that tracks the most common resource related waits.

SELECT map_key, map_value
FROM sys.dm_xe_map_values
WHERE name = 'wait_types'
  AND ((map_key > 0 AND map_key < 22) -- LCK_ waits
            OR (map_key > 31 AND map_key < 38) -- LATCH_ waits
            OR (map_key > 47 AND map_key < 54) -- PAGELATCH_ waits
            OR (map_key > 63 AND map_key < 70) -- PAGEIOLATCH_ waits
            OR (map_key > 96 AND map_key < 100) -- IO (Disk/Network) waits
            OR (map_key = 107) -- RESOURCE_SEMAPHORE waits
            OR (map_key = 113) -- SOS_WORKER waits
            OR (map_key = 120) -- SOS_SCHEDULER_YIELD waits
            OR (map_key = 178) -- WRITELOG waits
            OR (map_key > 174 AND map_key < 177) -- FCB_REPLICA_ waits
            OR (map_key = 186) -- CMEMTHREAD waits
            OR (map_key = 187) -- CXPACKET waits
            OR (map_key = 207) -- TRACEWRITE waits
            OR (map_key = 269) -- RESOURCE_SEMAPHORE_MUTEX waits
            OR (map_key = 283) -- RESOURCE_SEMAPHORE_QUERY_COMPILE waits
            OR (map_key = 284) -- RESOURCE_SEMAPHORE_SMALL_QUERY waits
        )
Once we have the list of map_key’s defined, we can do a replace in SSMS and change map_key to wait_type and define the predicate for the sqlos.wait_info Event for our Event Session.

CREATE EVENT SESSION [TrackResourceWaits] ON SERVER
ADD EVENT  sqlos.wait_info
(    -- Capture the database_id, session_id, plan_handle, and sql_text
    ACTION(sqlserver.database_id,sqlserver.session_id,sqlserver.sql_text,sqlserver.plan_handle)
    WHERE
        (opcode = 1 --End Events Only
            AND duration > 100 -- had to accumulate 100ms of time
            AND ((wait_type > 0 AND wait_type < 22) -- LCK_ waits
                    OR (wait_type > 31 AND wait_type < 38) -- LATCH_ waits
                    OR (wait_type > 47 AND wait_type < 54) -- PAGELATCH_ waits
                    OR (wait_type > 63 AND wait_type < 70) -- PAGEIOLATCH_ waits
                    OR (wait_type > 96 AND wait_type < 100) -- IO (Disk/Network) waits
                    OR (wait_type = 107) -- RESOURCE_SEMAPHORE waits
                    OR (wait_type = 113) -- SOS_WORKER waits
                    OR (wait_type = 120) -- SOS_SCHEDULER_YIELD waits
                    OR (wait_type = 178) -- WRITELOG waits
                    OR (wait_type > 174 AND wait_type < 177) -- FCB_REPLICA_ waits
                    OR (wait_type = 186) -- CMEMTHREAD waits
                    OR (wait_type = 187) -- CXPACKET waits
                    OR (wait_type = 207) -- TRACEWRITE waits
                    OR (wait_type = 269) -- RESOURCE_SEMAPHORE_MUTEX waits
                    OR (wait_type = 283) -- RESOURCE_SEMAPHORE_QUERY_COMPILE waits
                    OR (wait_type = 284) -- RESOURCE_SEMAPHORE_SMALL_QUERY waits
                )
        )
)
ADD TARGET package0.ring_buffer(SET max_memory=4096)
WITH (EVENT_RETENTION_MODE=ALLOW_SINGLE_EVENT_LOSS,
      MAX_DISPATCH_LATENCY=5 SECONDS)
GO


Now that we have the Event Session defined, we can start it as needed to collect the resource wait information for our system.  The only concern with this Event Session is the Target being used.  If the Event Session is going to run for a long period of time, or if the waits on the server being monitored occur in large quantities, the Target should be changed away from the ring_buffer to the asynchronous_file_target.  I configured this session to only collect waits that exceed 100ms in duration.  If you want waits that have shorter durations this can easily be changed.  If you set the duration to be > 0 a lot of 1-5ms waits will be collected that aren’t generally interesting.  To query the wait information from this Event Session using the ring_buffer:

-- Extract the Event information from the Event Session
SELECT
    event_data.value('(event/@name)[1]', 'varchar(50)') AS event_name,
    DATEADD(hh,
        DATEDIFF(hh, GETUTCDATE(), CURRENT_TIMESTAMP),
        event_data.value('(event/@timestamp)[1]', 'datetime2')) AS [timestamp],
    COALESCE(event_data.value('(event/data[@name="database_id"]/value)[1]', 'int'),
        event_data.value('(event/action[@name="database_id"]/value)[1]', 'int')) AS database_id,
    event_data.value('(event/action[@name="session_id"]/value)[1]', 'int') AS [session_id],
    event_data.value('(event/data[@name="wait_type"]/text)[1]', 'nvarchar(4000)') AS [wait_type],
    event_data.value('(event/data[@name="opcode"]/text)[1]', 'nvarchar(4000)') AS [opcode],
    event_data.value('(event/data[@name="duration"]/value)[1]', 'bigint') AS [duration],
    event_data.value('(event/data[@name="max_duration"]/value)[1]', 'bigint') AS [max_duration],
    event_data.value('(event/data[@name="total_duration"]/value)[1]', 'bigint') AS [total_duration],
    event_data.value('(event/data[@name="signal_duration"]/value)[1]', 'bigint') AS [signal_duration],
    event_data.value('(event/data[@name="completed_count"]/value)[1]', 'bigint') AS [completed_count],
    event_data.value('(event/action[@name="plan_handle"]/value)[1]', 'nvarchar(4000)') AS [plan_handle],
    event_data.value('(event/action[@name="sql_text"]/value)[1]', 'nvarchar(4000)') AS [sql_text]
FROM
(    SELECT XEvent.query('.') AS event_data
    FROM
    (    -- Cast the target_data to XML
        SELECT CAST(target_data AS XML) AS TargetData
        FROM sys.dm_xe_session_targets st
        JOIN sys.dm_xe_sessions s
            ON s.address = st.event_session_address
        WHERE name = 'TrackResourceWaits'
          AND target_name = 'ring_buffer'
    ) AS Data
    -- Split out the Event Nodes
    CROSS APPLY TargetData.nodes ('RingBufferTarget/event') AS XEventData (XEvent)
) AS tab (event_data)


In the result set, you will notice that some of the wait_info Events do not have an associated session_id, database_id, plan_handle, or sql_text value.  Depending on where the wait actually occurs in code, this information is not available to the firing Event, for example, the NETWORK_IO Event generally does not successfully collect these Actions.

While collecting session and statement level waits like this is certainly interesting, there are some considerations that have to be made whenever you look at wait information like this.  The first consideration is that, while a specific session or statement waited on a resource, that doesn’t necessarily mean that the problem exists within that session or statement.  Take for example a query that has to wait 500ms on ASYNC_IO_COMPLETION waits.  At the same time that query is executing there are 10 DSS queries running that scan large ranges of data from the database data files and generate a lot of IO activity.  Where exactly is the problem?  The root problem is that there is a disk IO bottleneck, but not necessarily related to the query that is waiting on disk IO, it could be another query performing Table Scan that is leading to the heavy IO activity.
Event Session DDL Events
http://www.sqlskills.com/blogs/jonathan/an-xevent-a-day-31-of-31-event-session-ddl-events/
扩展事件 DDL事件
To close out this month’s series on Extended Events we’ll look at the DDL Events for the Event Session DDL operations, and how those can be used to track changes to Event Sessions and determine all of the possible outputs that could exist from an Extended Event Session.  One of my least favorite quirks about Extended Events is that there is no way to determine the Events and Actions that may exist inside a Target, except to parse all of the the captured data.  Information about the Event Session does exist in the Session Definition Catalog Views and Active Session DMV’s, but as you change an Event Sessions Events and Actions while it is running, the information in these change as well, so it is possible that a Target has Events and Actions that are not returned by the current information available about the Event Session.  This is where the DDL Events for the Event Session DDL operations can be useful, if the appropriate framework is deployed.

The DDL Events for Extended Events are not currently documented in the Books Online.  I only recently learned about them from Mike Wachal during a discussion about what I thought was missing from Extended Events.  This is simply an oversight in the documentation, and something that Mike has stated will be fixed, it doesn’t mean that the DDL Events are undocumented and subject to change without notice like other undocumented features of SQL Server.  We can find the DDL Events for Extended Events in the sys.event_notification_event_types.

SELECT
    type,
    type_name,
    parent_type
FROM sys.event_notification_event_types
WHERE type_name LIKE '%SESSION%'
An XEvent a Day (31 of 31)   Event Session DDL Events   image thumb

These can be used just like any other DDL Event to create a DDL Trigger or Event Notification that takes action when one of the DDL operations occurs.  We can use this to log the DDL to track our changes over time, and we can also use it to create a tracking table of the possible outputs from our Event Session, ensuring that we know what information it may have collected when we parse the Event data from the Targets.  We can also use this information to simplify the generation of our XQuery XPATH statements to parse the data from the Targets with a little extra work.

In all of my servers, I have a standard database named sqladmin that I keep DBA related information and objects.  For the examples, I will create this database and use it in all the code.  If you have a different database, the scripts can easily be changed to create the objects in that database.  The first thing we’ll do is create our database, and two tables, one for tracking the DDL operations and the other for tracking all of the possible outputs for our Event Session.

CREATE DATABASE sqladmin
GO
USE sqladmin
GO
CREATE TABLE dbo.XEvents_DDLOperations
( DDLEventData XML,
  ChangeDate DATETIME DEFAULT(CURRENT_TIMESTAMP),
  LoginName NVARCHAR(256) DEFAULT(SUSER_SNAME()),
  ProgramName NVARCHAR(256) DEFAULT(program_name())
);
GO
CREATE TABLE XEvents_SessionOutputs
(
    EventSessionName NVARCHAR(256),
    EventName NVARCHAR(256),
    EventID INT,
    ColumnID INT,
    ColumnName NVARCHAR(256),
    NodeType NVARCHAR(10),
    DataType NVARCHAR(50),
    XMLLocation NVARCHAR(10),
    TypePrecidence INT
)
GO
The XEvents_SessionOutputs table will have multiple rows for each Event Session defined on the server that track the EventName, the output ColumnName, the NodeType for the data element in the Event XML, the SQL DataType returned by the output, the XMLLocation for where the data of interest exists, and a TypePrecidence value that can be used when multiple Events return the same Data Element with different DataTypes, ensuring that we can pick the most compatible DataType for the output column.  The table also tracks the Event ID in the Event Session for the Event, the Column ID for the output column so that grouping and ordering can be performed during code generation from this table.

To get the SQL DataType that an output returns, we have to look at the output type_name in the Extended Events metadata for the output column or Action.  To make this easier to do and allow for code reuse, I create a view that maps the type_name in Extended Events to corresponding SQL DataType.  Since Maps can be a type_name in Extended Events, the view queries the sys.dm_xe_map_values DMV and calculates the maximum length of the map_value column for each Map, and then uses the nvarchar datatype and rounds the length up to the nearest power of 10 (ok, it doesn’t actually round but that is the effect of the math operations).  For the actual Event data columns in the base payload, the type_name is transposed to the equivalent SQL DataType that is compatible with XQuery.

CREATE VIEW dbo.XETypeToSQLType
AS
    SELECT
        XETypeName = mv.name,
        SQLTypeName = 'nvarchar('+CAST(MAX(LEN(mv.map_value))-(MAX(LEN(mv.map_value))%10) + 10 AS VARCHAR(4))+')',
        XMLLocation = 'text',
        TypePrecidence = 5
    FROM sys.dm_xe_object_columns oc
    LEFT JOIN sys.dm_xe_map_values mv
        ON oc.type_package_guid = mv.object_package_guid
            AND oc.type_name = mv.name
    WHERE oc.column_type = 'data'
      AND mv.name IS NOT NULL
    GROUP BY mv.name
UNION ALL
    SELECT
        XETypeName = o.name,
        SQLTypeName = CASE
                            WHEN TYPE_NAME IN ('int8', 'int16', 'int32', 'uint8',
                                    'uint16', 'uint32', 'float32')
                                THEN 'int'
                            WHEN TYPE_NAME IN ('int64', 'uint64', 'float64')
                                THEN 'bigint'
                            WHEN TYPE_NAME = 'boolean'
                                THEN 'nvarchar(10)' --true/false returned
                            WHEN TYPE_NAME = 'guid'
                                THEN 'uniqueidentifier'
                            ELSE 'nvarchar(4000)'
                        END,
        XMLLocation = 'value',
        TypePrecidence = CASE
                            WHEN TYPE_NAME IN ('int8', 'int16', 'int32', 'uint8',
                                    'uint16', 'uint32', 'float32')
                                THEN 1
                            WHEN TYPE_NAME IN ('int64', 'uint64', 'float64')
                                THEN 2
                            WHEN TYPE_NAME = 'boolean'
                                THEN 3 --true/false returned
                            WHEN TYPE_NAME = 'guid'
                                THEN 3
                            ELSE 5
                         END
    FROM sys.dm_xe_objects o
    WHERE object_type = 'type'
      AND TYPE_NAME != 'null'
GO
Using this view, we can create another view that queries the Session Definition Catalog Views, to retrieve the output columns for an Event Session in a format that matches our XEvents_SessionOutputs table.

CREATE VIEW dbo.XESession_OutputsFromDMVs
AS
        -- Find a list of all the possible output columns
        SELECT
            ses.name AS EventSessionName,
            sese.name AS EventName,
            sese.event_id AS EventID,
            oc.column_id AS ColumnID,
            oc.name AS ColumnName,
            'data' AS NodeType,
            xetst.SQLTypeName AS DataType,
            xetst.XMLLocation,
            xetst.TypePrecidence
        FROM sys.server_event_sessions AS ses
        JOIN sys.server_event_session_events AS sese
            ON ses.event_session_id = sese.event_session_id
        JOIN sys.dm_xe_packages AS p
            ON sese.package = p.name
        JOIN sys.dm_xe_object_columns AS oc
            ON oc.object_name = sese.name
                AND oc.object_package_guid = p.guid
        JOIN XETypeToSQLType AS xetst
            ON oc.type_name = xetst.XETypeName
        WHERE oc.column_type = 'data'
    UNION
        SELECT
            ses.name,
            sese.name,
            sesa.event_id,
            999 AS column_id,
            sesa.name,
            'action',
            xetst.SQLTypeName,
            xetst.XMLLocation,
            xetst.TypePrecidence
        FROM sys.server_event_sessions AS ses
        JOIN sys.server_event_session_events AS sese
            ON ses.event_session_id = sese.event_session_id
        JOIN sys.server_event_session_actions AS sesa
            ON ses.event_session_id = sesa.event_session_id
                AND sesa.event_id = sese.event_id
        JOIN sys.dm_xe_packages AS p
            ON sesa.package = p.name
        JOIN sys.dm_xe_objects AS o
            ON p.guid = o.package_guid
                AND sesa.name = o.name
        JOIN XETypeToSQLType AS xetst
            ON o.type_name = xetst.XETypeName
        WHERE o.object_type = 'action'
GO
We can then create a Server Level DDL Trigger for the DDL_EVENT_SESSION_EVENTS group that will log the DDL operation to the XEvents_DDLOperations table, and at the same time populate the output information in the XEvents_SessionOutputs table when an Event Session is created, add any new outputs when an Event Session is altered, and delete the Event Session information when an Event Session is dropped.  By adding new outputs when a Event Session is altered, we maintain a record of the original outputs, even if the Event was dropped from the Event Session.

CREATE TRIGGER XEvents_DDLTrigger
ON ALL SERVER
FOR DDL_EVENT_SESSION_EVENTS
AS
BEGIN
    SET NOCOUNT ON;
    DECLARE @EventData XML = EVENTDATA();
    INSERT INTO sqladmin.dbo.XEvents_DDLOperations (DDLEventData)
    VALUES (@EventData);

    DECLARE @EventType NVARCHAR(256) = @EventData.value('(EVENT_INSTANCE/EventType)[1]', 'nvarchar(256)')
    DECLARE @SessionName NVARCHAR(256) = @EventData.value('(EVENT_INSTANCE/ObjectName)[1]', 'nvarchar(256)')

    IF @EventType = 'CREATE_EVENT_SESSION'
    BEGIN
        INSERT INTO sqladmin.dbo.XEvents_SessionOutputs
            (EventSessionName, EventName, EventID, ColumnID, ColumnName, NodeType,
             DataType, XMLLocation, TypePrecidence)
        SELECT EventSessionName, EventName, EventID, ColumnID, ColumnName, NodeType,
             DataType, XMLLocation, TypePrecidence
        FROM sqladmin.dbo.XESession_OutputsFromDMVs
        WHERE EventSessionName = @SessionName
    END

    IF @EventType = 'ALTER_EVENT_SESSION'
    BEGIN
        -- Add any new outputs to the Table
        INSERT INTO sqladmin.dbo.XEvents_SessionOutputs
            (EventSessionName, EventName, EventID, ColumnID, ColumnName, NodeType,
             DataType, XMLLocation, TypePrecidence)
        SELECT vdmv.EventSessionName, vdmv.EventName, vdmv.EventID, vdmv.ColumnID, vdmv.ColumnName, vdmv.NodeType,
             vdmv.DataType, vdmv.XMLLocation, vdmv.TypePrecidence
        FROM sqladmin.dbo.XESession_OutputsFromDMVs vdmv
        LEFT JOIN sqladmin.dbo.XEvents_SessionOutputs xeso
            ON vdmv.EventSessionName = xeso.EventSessionName
                AND vdmv.EventName = xeso.EventName
                AND vdmv.ColumnName = vdmv.ColumnName
        WHERE vdmv.EventSessionName = @SessionName
          AND xeso.EventSessionName IS NULL
    END

    IF @EventType = 'DROP_EVENT_SESSION'
    BEGIN
        -- Delete the Output data for the Event Session
        DELETE sqladmin.dbo.XEvents_SessionOutputs
        WHERE EventSessionName = @SessionName
    END
END
GO
If we recreate the TrackResourceWaits Event Session from yesterday’s post and then query the XEvents_SessionOutputs table, we can see the outputs that we can expect from that Event Session:

SELECT *
FROM sqladmin.dbo.XEvents_SessionOutputs
WHERE EventSessionName = 'TrackResourceWaits'

An XEvent a Day (31 of 31)   Event Session DDL Events   image thumb

Using this information, we can also write a query to generate our XQuery statements for each of the outputs, as well as a column definition stub if we wanted to create a table to hold this information for analysis.

SELECT
    'event_data.value(''(event/'+NodeType+'[@name="'+ColumnName+'"]/'+XMLLocation+')[1]'', '''+DataType+''') AS '+QUOTENAME(ColumnName)+',' AS XQuery,
    QUOTENAME(ColumnName)+' '+DataType+', ' AS ColumnDefinition
FROM
(
    SELECT
        ROW_NUMBER() OVER (PARTITION BY ColumnName ORDER BY TypePrecidence DESC) AS partitionid,
        EventSessionName,
        EventID,
        ColumnID,
        ColumnName,
        NodeType,
        DataType,
        XMLLocation
    FROM sqladmin.dbo.XEvents_SessionOutputs
) AS tab
WHERE EventSessionName = 'TrackResourceWaits'
  AND partitionid = 1
ORDER BY EventID, ColumnID
An XEvent a Day (31 of 31)   Event Session DDL Events   image thumb

The information in the XQuery column can be copied and pasted into our TSQL Script for parsing the Event Data from the ring_buffer, pair_matching, or asynchronous_file_target Targets.  You could also use this as the basis for writing your own Extended Events Target Data code generator, similar to the one that Adam Machanic created a year ago.

That’s it for this months series on Extended Events.  You can find links to all of the posts on the round up post from December 1, An XEvent A Day: 31 days of Extended Events.  Hopefully its been informative, and you now have a better understanding of how Extended Events can be used inside of SQL Server 2008, 2008R2, and in Denali CTP1.
Incorrect Timestamp on Events in Extended Events
https://www.sqlskills.com/blogs/jonathan/incorrect-timestamp-on-events-in-extended-events/
在扩展事件里面不正确的时间戳事件
Last week, Denny Cherry (Blog|Twitter) asked why the timestamp on the events he was collecting using Extended Events in SQL Server 2008 was incorrect.  I’ve seen this a couple of times on the MSDN Forums, and its come up a couple of times in discussions with other MVP’s about Extended Events.  According to a feedback item I found on Connect for this problem, this is a bug that has been addressed and will be in SQL Server 2008 R2 SP1, and I can only assume a Cumulative Update for SQL Server 2008 that is released in the future as well.

At the time that Denny asked about this, I happened to have a virtual machine on my laptop that had been running and suspended for a couple of months and I was able to see the issue occurring on it.  Up until this point I had never actually seen the issue occur personally, but with this virtual machine I was able to play around with a event session to see if there was anyway to work around this problem.  I started off with a basic event session that collected the sqlserver.sql_statement_starting event and then added different actions to it to see what other information was available.  I hit pay dirt with the package0.collect_system_time action which reported the correct datetime value in UTC for the events, even when the event timestamp was incorrect as shown in the following eventdata xml:

<event name="sql_statement_starting" package="sqlserver" timestamp="2011-03-04T15:56:30.612Z">
  <data name="state">
    <type name="statement_starting_state" package="sqlserver" />
    <value>0</value>
    <text>Normal</text>
  </data>
  <data name="line_number">
    <type name="int32" package="package0" />
    <value>6</value>
  </data>
  <data name="offset">
    <type name="int32" package="package0" />
    <value>130</value>
  </data>
  <data name="offset_end">
    <type name="int32" package="package0" />
    <value>-1</value>
  </data>
  <data name="statement">
    <type name="unicode_string" package="package0" />
    <value>SELECT @@VERSION</value>
  </data>
  <action name="collect_system_time" package="package0">
    <type name="filetime" package="package0" />
    <value>2011-03-16T00:58:13.792Z</value>
  </action>
</event>

This is a fairly insidious bug that affects every event session on the server, including the default system_health session that is running on every SQL Server 2008 instance.  Unlike the default trace in SQL Server, the Extended Events system_health session can be modified to change the information that is being collected.  While I would not change the events or predicates, I would add the sqlserver.collect_system_time action to each of the events so that if you need information from the system_health session, you know when an event actually fired.  The script for the system_health session is available in the utables.sql script file that is in the Install folder under the instance root for each instance of SQL Server.  Using this as a base you can easily modify it as follows to add the additional action to each event.

– Extended events default session
IF EXISTS(SELECT * FROM sys.server_event_sessions WHERE name=’system_health’)
    DROP EVENT SESSION system_health ON SERVER
GO
– The predicates in this session have been carefully crafted to minimize impact of event collection
– Changing the predicate definition may impact system performance
–
CREATE EVENT SESSION system_health ON SERVER
ADD EVENT sqlserver.error_reported
(
    ACTION (package0.callstack, sqlserver.session_id, sqlserver.sql_text, sqlserver.tsql_stack, package0.collect_system_time)
    — Get callstack, SPID, and query for all high severity errors ( above sev 20 )
    WHERE severity >= 20
    — Get callstack, SPID, and query for OOM errors ( 17803 , 701 , 802 , 8645 , 8651 , 8657 , 8902 )
    OR (error = 17803 OR error = 701 OR error = 802 OR error = 8645 OR error = 8651 OR error = 8657 OR error = 8902)
),
ADD EVENT sqlos.scheduler_monitor_non_yielding_ring_buffer_recorded
(
    ACTION (package0.collect_system_time)
),
ADD EVENT sqlserver.xml_deadlock_report
(
    ACTION (package0.collect_system_time)
),
ADD EVENT sqlos.wait_info
(
    ACTION (package0.callstack, sqlserver.session_id, sqlserver.sql_text, package0.collect_system_time)
    WHERE
    (duration > 15000 AND
        (
            (wait_type > 31    — Waits for latches and important wait resources (not locks ) that have exceeded 15 seconds.
                AND
                (
                    (wait_type > 47 AND wait_type < 54)
                    OR wait_type < 38
                    OR (wait_type > 63 AND wait_type < 70)
                    OR (wait_type > 96 AND wait_type < 100)
                    OR (wait_type = 107)
                    OR (wait_type = 113)
                    OR (wait_type > 174 AND wait_type < 179)
                    OR (wait_type = 186)
                    OR (wait_type = 207)
                    OR (wait_type = 269)
                    OR (wait_type = 283)
                    OR (wait_type = 284)
                )
            )
            OR
            (duration > 30000        — Waits for locks that have exceeded 30 secs.
                AND wait_type < 22
            )
        )
    )
),
ADD EVENT sqlos.wait_info_external
(
    ACTION (package0.callstack, sqlserver.session_id, sqlserver.sql_text, package0.collect_system_time)
    WHERE
    (duration > 5000 AND
        (
            (    — Login related preemptive waits that have exceeded 5 seconds.
                (wait_type > 365 AND wait_type < 372)
                OR (wait_type > 372 AND wait_type < 377)
                OR (wait_type > 377 AND wait_type < 383)
                OR (wait_type > 420 AND wait_type < 424)
                OR (wait_type > 426 AND wait_type < 432)
                OR (wait_type > 432 AND wait_type < 435)
            )
            OR
            (duration > 45000     — Preemptive OS waits that have exceeded 45 seconds.
                AND
                (
                    (wait_type > 382 AND wait_type < 386)
                    OR (wait_type > 423 AND wait_type < 427)
                    OR (wait_type > 434 AND wait_type < 437)
                    OR (wait_type > 442 AND wait_type < 451)
                    OR (wait_type > 451 AND wait_type < 473)
                    OR (wait_type > 484 AND wait_type < 499)
                    OR wait_type = 365
                    OR wait_type = 372
                    OR wait_type = 377
                    OR wait_type = 387
                    OR wait_type = 432
                    OR wait_type = 502
                )
            )
        )
    )
)
ADD TARGET package0.ring_buffer        — Store events in the ring buffer target
    (SET MAX_MEMORY = 4096)
WITH (STARTUP_STATE = ON);
GO

When the fix for this bug is released in SQL Server, the customization of the system_health event session can be undone by running the original script in the utables.sql file, which will revert the event session configuration back to its default.
Extended Events Changes in SQL Server 2012 – Event XML for XML data elements
--https://www.sqlskills.com/blogs/jonathan/extended-events-changes-in-sql-server-2012/
sql2012扩展事件的改变 扩展XML对于 xml数据元素 使用扩展xml来解释扩展事件xel
While working on validating my demos for the 24 Hours of PASS and my PASS Summit 2011 Precon – Extended Events Deep Dive, I noticed a significant, and breaking change to the Event XML output for the raw event data in the ring_buffer and file_target in SQL Server Denali. In SQL Server 2008 and 2008R2, the Event XML represented the output of XML data elements differently than in SQL Server Denali CTP3. A good example of this is the xml_deadlock_report output, which I previously discussed in my SQL Server Central article, In SQL Server 2008 and 2008R2, the query to retrieve the deadlock graph from the system_health session was (excluding the work around that was included in the original article since the xml_deadlock_report was fixed in a later Cumulative Update and the latest Service Pack for SQL Server 2008 and 2008 R2). 1 2 3 4 5 6 7 8 9 10 11 12 13 14 15 16 SELECT CAST(event_data.value('(data/value)[1]', 'varchar(max)')) AS XML) AS DeadlockGraph FROM ( SELECT XEvent.query('.') AS event_data FROM ( -- Cast the target_data to XML SELECT CAST(target_data AS XML) AS TargetData FROM sys.dm_xe_session_targets AS st INNER JOIN sys.dm_xe_sessions AS s ON s.address = st.event_session_address WHERE name = N'system_health' AND target_name = N'ring_buffer' ) AS Data -- Split out the Event Nodes CROSS APPLY TargetData.nodes ('RingBufferTarget/event[@name="xml_deadlock_report"]') AS XEventData (XEvent) ) AS tab (event_data); If you run this same code in SQL Server Denali CTP3, the output will not be the xml_deadlock_report but instead the textual data that was included in the sub-nodes of the value node for the xml_deadlock_report events in the target. This unfortunately has broken a number of my scripts that were initially written for SQL Server 2008 and 2008R2 that expect the XML output as text in the value element as follows: <event name="xml_deadlock_report" package="sqlserver" id="123" version="1" timestamp="2011-09-15T23:29:02.851Z"> <data name="xml_report"> <type name="unicode_string" package="package0" /> <value><deadlock-list> <victim-list> <victimProcess id="process806e2088"/> <process-list> <process id="process806e2088" taskpriority="0" logused="10000" waitresource="DATABASE: 15 " waittime="1477" schedulerid="2" kpid="3720" status="suspended" spid="57" sbid="0" ecid="0" priority="0" trancount="1" lastbatchstarted="2011-09-15T19:29:01.370" lastbatchcompleted="2011-09-15T19:27:21.193" clientapp="Microsoft SQL Server Management Studio – Query" hostname="SQL2K8R2-IE2" hostpid="4464" loginname="SQLSKILLSDEMOS\administrator" isolationlevel="read committed (2)" xactid="68641" currentdb="15" lockTimeout="4294967295" clientoption1="671090784" clientoption2="390200"> <executionStack> <frame procname="" line="1" sqlhandle="0x01000100721ac42240ff1285000000000000000000000000"> </frame> </executionStack> <inputbuf> ALTER DATABASE DemoNCIndex SET MULTI_USER </inputbuf> </process> <process id="process469b88" taskpriority="0" logused="10000" waitresource="DATABASE: 15 " waittime="1892" schedulerid="2" kpid="4188" status="suspended" spid="58" sbid="0" ecid="0" priority="0" trancount="0" lastbatchstarted="2011-09-15T19:29:00.957" lastbatchcompleted="2011-09-15T19:29:00.947" clientapp="Microsoft SQL Server Management Studio – Transact-SQL IntelliSense" hostname="SQL2K8R2-IE2" hostpid="4464" loginname="SQLSKILLSDEMOS\administrator" isolationlevel="read committed (2)" xactid="68638" currentdb="15" lockTimeout="4294967295" clientoption1="671088672" clientoption2="128056"> <executionStack> <frame procname="" line="1" sqlhandle="0x010001008af5b714605a1f85000000000000000000000000"> </frame> </executionStack> <inputbuf> use [DemoNCIndex] </inputbuf> </process> </process-list> <resource-list> <databaselock subresource="FULL" dbid="15" dbname="" id="lock83168d80" mode="S"> <owner-list> <owner id="process469b88" mode="S"/> </owner-list> <waiter-list> <waiter id="process806e2088" mode="X" requestType="wait"/> </waiter-list> </databaselock> <databaselock subresource="FULL" dbid="15" dbname="" id="lock83168d80" mode="S"> <owner-list> <owner id="process806e2088" mode="S"/> <owner id="process806e2088" mode="S"/> </owner-list> <waiter-list> <waiter id="process469b88" mode="X" requestType="wait"/> </waiter-list> </databaselock> </resource-list> </deadlock> </deadlock-list> </value> <text /> </data> </event> Instead in SQL Server Denali CTP3, the event output is as follows: <event name="xml_deadlock_report" package="sqlserver" timestamp="2011-09-17T18:49:03.654Z"> <data name="xml_report"> <type name="xml" package="package0" /> <value> <deadlock> <victim-list> <victimProcess id="processf7034a18" /> </victim-list> <process-list> <process id="processf7034a18" taskpriority="0" logused="144" waitresource="RID: 2:1:281:0" waittime="2394" ownerId="162349" transactionname="user_transaction" lasttranstarted="2011-09-17T11:48:48.410" XDES="0xff047120" lockMode="S" schedulerid="2" kpid="692" status="suspended" spid="58" sbid="0" ecid="0" priority="0" trancount="1" lastbatchstarted="2011-09-17T11:49:01.247" lastbatchcompleted="2011-09-17T11:48:48.410" lastattention="2011-09-17T11:39:47.393" clientapp="Microsoft SQL Server Management Studio – Query" hostname="WIN-QSTGAPD63IN" hostpid="3004" loginname="WIN-QSTGAPD63IN\Administrator" isolationlevel="read committed (2)" xactid="162349" currentdb="2" lockTimeout="4294967295" clientoption1="671090784" clientoption2="390200"> <executionStack> <frame procname="adhoc" line="1" sqlhandle="0x02000000303b01237c6994b4eab30fb77cbb5a8e46f2b2540000000000000000000000000000000000000000"> SELECT Column2 FROM TableB </frame> </executionStack> <inputbuf> SELECT Column2 FROM TableB </inputbuf> </process> <process id="processf7035168" taskpriority="0" logused="144" waitresource="RID: 2:1:271:0" waittime="7494" ownerId="162369" transactionname="user_transaction" lasttranstarted="2011-09-17T11:48:53.693" XDES="0xf7044dd0" lockMode="S" schedulerid="2" kpid="3244" status="suspended" spid="60" sbid="0" ecid="0" priority="0" trancount="1" lastbatchstarted="2011-09-17T11:48:56.150" lastbatchcompleted="2011-09-17T11:48:53.693" lastattention="1900-01-01T00:00:00.693" clientapp="Microsoft SQL Server Management Studio – Query" hostname="WIN-QSTGAPD63IN" hostpid="3004" loginname="WIN-QSTGAPD63IN\Administrator" isolationlevel="read committed (2)" xactid="162369" currentdb="2" lockTimeout="4294967295" clientoption1="671090784" clientoption2="390200"> <executionStack> <frame procname="adhoc" line="2" stmtstart="4" sqlhandle="0x020000002e8952007a6c36a78a2aa436877a27f57a0725c80000000000000000000000000000000000000000"> SELECT Column1 FROM TableA </frame> </executionStack> <inputbuf> SELECT Column1 FROM TableA </inputbuf> </process> </process-list> <resource-list> <ridlock fileid="1" pageid="281" dbid="2" objectname="tempdb.dbo.TABLEB" id="lockf7d4ff80" mode="X" associatedObjectId="2161727822326792192"> <owner-list> <owner id="processf7035168" mode="X" /> </owner-list> <waiter-list> <waiter id="processf7034a18" mode="S" requestType="wait" /> </waiter-list> </ridlock> <ridlock fileid="1" pageid="271" dbid="2" objectname="tempdb.dbo.TABLEA" id="lockf7d51380" mode="X" associatedObjectId="2089670228247904256"> <owner-list> <owner id="processf7034a18" mode="X" /> </owner-list> <waiter-list> <waiter id="processf7035168" mode="S" requestType="wait" /> </waiter-list> </ridlock> </resource-list> </deadlock> </value> </data> </event> If you compare the two bold sections to each other you will notice the difference. In SQL Server 2008 and 2008R2, the value element is XML escaped entirely as text, but in SQL Server Denali CTP3, the value attribute contains a valid XML document as a child node in the XML itself. This has a significant impact to how you actually access the XML data in Denali CTP3. To read the XML Document, you have to switch from using the .value() XML function along with a CAST() operation to using a .query() operation on the Event XML specifying the deadlock node as a part of the .query() XPATH for it as shown in the following code example: 1 2 3 4 5 6 7 8 9 10 11 12 13 14 15 16 SELECT event_data.query('(event/data/value/deadlock)[1]') AS DeadlockGraph FROM ( SELECT XEvent.query('.') AS event_data FROM ( -- Cast the target_data to XML SELECT CAST(target_data AS XML) AS TargetData FROM sys.dm_xe_session_targets AS st INNER JOIN sys.dm_xe_sessions AS s ON s.address = st.event_session_address WHERE name = N'system_health' AND target_name = N'ring_buffer' ) AS Data -- Split out the Event Nodes CROSS APPLY TargetData.nodes ('RingBufferTarget/event[@name="xml_deadlock_report"]') AS XEventData (XEvent) ) AS tab (event_data); This same thing applies to all of the XML data elements including the sqlserver.tsql_stack and sqlserver.tsql_frame Actions. In addition other actions such as the sqlserver.plan_handle have similar changes that require changing the code to process the Event XML to capture the values being output.
Tracking SQL Server Database Usage
跟踪sql数据库使用率
https://www.sqlskills.com/blogs/jonathan/tracking-sql-server-database-usage/
One of the challenges with inheriting an existing set of SQL Servers and databases when you start a new job can be determining which of the databases are actively being used or not, especially on development and testing systems where there may be multiple copies of the same database that were used by different projects over time. This can also be a challenge for multi-tenant software as a service (SaaS) providers that create a new database for each client they provide service for. An easy way to track whether a database is being used is with Extended Events and the lock_acquired event by filtering for the shared transaction workspace (SharedXactWorkspace) lock that is acquired anytime a user connects to the database.

To start off, we first need to look up the columns returned by the lock_acquired event, and also look up the map values associated with any of the columns so that we know the correct values to use in our event session definition.

1
2
3
4
5
6
7
8
9
10
11
12
13
14
15
16
17
-- Look up the lock_acquired event columns
SELECT
    name,
    column_id,
    type_name
FROM sys.dm_xe_object_columns
WHERE object_name = N'lock_acquired' AND
    column_type = N'data';

-- Look up the values for the Lock Resource Type and the Lock Owner Type
SELECT
    name,
    map_key,
    map_value
FROM sys.dm_xe_map_values
WHERE name IN (N'lock_resource_type',
N'lock_owner_type');
From this, we can get the DATABASE lock_resource_type map_key=2 and the SharedXactWorkspace lock_owner_type map_key=4. With these values, we can define our event session to track how frequently this lock occurs by database_id, and leverage the bucketizer/histogram target to bucket the data automatically. Since the target name and output changed slightly in SQL Server 2012, two different version specific examples of the event session and event parsing code are presented below:

SQL Server 2008 Event Session

1
2
3
4
5
6
7
8
9
10
11
12
13
14
15
16
17
18
19
20
21
22
23
24
25
26
27
28
29
30
31
32
33
34
35
36
37
38
39
40
41
42
43
44
45
46
-- If the Event Session Exists, drop it first
IF EXISTS (SELECT 1
            FROM sys.server_event_sessions
            WHERE name = 'SQLskills_DatabaseUsage')
    DROP EVENT SESSION [SQLskills_DatabaseUsage]
    ON SERVER;

-- Create the Event Session
CREATE EVENT SESSION [SQLskills_DatabaseUsage]
ON SERVER
ADD EVENT sqlserver.lock_acquired(
    WHERE owner_type = 4 -- SharedXactWorkspace
      AND resource_type = 2 -- Database level lock
      AND database_id > 4 -- non system database
      AND sqlserver.is_system = 0 -- must be a user process
)
ADD TARGET package0.asynchronous_bucketizer
( SET slots = 32, -- Adjust based on number of databases in instance
      filtering_event_name='sqlserver.lock_acquired', -- aggregate on the lock_acquired event
      source_type=0, -- event data and not action data
      source='database_id' -- aggregate by the database_id
)
WITH(MAX_DISPATCH_LATENCY =1SECONDS); -- dispatch immediately and don't wait for full buffers
GO

-- Start the Event Session
ALTER EVENT SESSION [SQLskills_DatabaseUsage]
ON SERVER
STATE = START;
GO

-- Parse the session data to determine the databases being used.
SELECT  slot.value('./@count', 'int') AS [Count] ,
        DB_NAME(slot.query('./value').value('.', 'int')) AS [Database]
FROM
(
    SELECT CAST(target_data AS XML) AS target_data
    FROM sys.dm_xe_session_targets AS t
    INNER JOIN sys.dm_xe_sessions AS s
        ON t.event_session_address = s.address
    WHERE   s.name = 'SQLskills_DatabaseUsage'
      AND t.target_name = 'asynchronous_bucketizer') AS tgt(target_data)
CROSS APPLY target_data.nodes('/BucketizerTarget/Slot') AS bucket(slot)
ORDER BY slot.value('./@count', 'int') DESC

GO
SQL Server 2012 Event Session

1
2
3
4
5
6
7
8
9
10
11
12
13
14
15
16
17
18
19
20
21
22
23
24
25
26
27
28
29
30
31
32
33
34
35
36
37
38
39
40
41
42
43
44
45
-- If the Event Session Exists, drop it first
IF EXISTS (SELECT 1
            FROM sys.server_event_sessions
            WHERE name = 'SQLskills_DatabaseUsage')
    DROP EVENT SESSION [SQLskills_DatabaseUsage]
    ON SERVER;

-- Create the Event Session
CREATE EVENT SESSION [SQLskills_DatabaseUsage]
ON SERVER
ADD EVENT sqlserver.lock_acquired(
    WHERE owner_type = 4 -- SharedXactWorkspace
      AND resource_type = 2 -- Database level lock
      AND database_id > 4 -- non system database
      AND sqlserver.is_system = 0 -- must be a user process
)
ADD TARGET package0.histogram
( SET slots = 32, -- Adjust based on number of databases in instance
      filtering_event_name='sqlserver.lock_acquired', -- aggregate on the lock_acquired event
      source_type=0, -- event data and not action data
      source='database_id' -- aggregate by the database_id
); -- dispatch immediately and don't wait for full buffers
GO

-- Start the Event Session
ALTER EVENT SESSION [SQLskills_DatabaseUsage]
ON SERVER
STATE = START;
GO

-- Parse the session data to determine the databases being used.
SELECT  slot.value('./@count', 'int') AS [Count] ,
        DB_NAME(slot.query('./value').value('.', 'int')) AS [Database]
FROM
(
    SELECT CAST(target_data AS XML) AS target_data
    FROM sys.dm_xe_session_targets AS t
    INNER JOIN sys.dm_xe_sessions AS s
        ON t.event_session_address = s.address
    WHERE   s.name = 'SQLskills_DatabaseUsage'
      AND t.target_name = 'histogram') AS tgt(target_data)
CROSS APPLY target_data.nodes('/HistogramTarget/Slot') AS bucket(slot)
ORDER BY slot.value('./@count', 'int') DESC

GO
One thing to keep in mind with this event session is that while a end user might not actually use a database, other tasks like maintenance, backups, CHECKDB, or even using intellisense in SQL Server Management Studio will. It is therefore, expected that databases not being used by end users would still show up inside of the histogram target, but the frequency of usage would be significantly lower than the databases that are actively being used by end users or applications.
Logging Extended Events changes to the ERRORLOG
将扩展事件的DDL更改记录到sql errorlog
--https://www.sqlskills.com/blogs/jonathan/logging-extended-events-changes/
在RAISERROR 里加 with log 记录到errorlog
http://www.cnblogs.com/xugang/archive/2011/04/09/2010216.html
RAISERROR(@msg, 10, 1, @SessionName, @LoginName) WITH LOG;
A question came up in class today about the difference between SQL Trace and Extended Events for logging information to the ERRORLOG file. Joe and I have both written about the observer overhead of Trace and Extended Events in the past (Observer Overhead and Wait Type Symptoms and Measuring “Observer Overhead” of SQL Trace vs. Extended Events), and one of the things we teach is to check whether a trace or event session may be running and impacting performance as a part of general troubleshooting performance problems in SQL Server. Anytime a user starts or stops a SQL Trace, information is logged in the ERRORLOG.

SQL Trace ID 2 was started by login “SQL2K8R2-IE2\Jonathan Kehayias”.
SQL Trace stopped. Trace ID = ’2′. Login Name = ‘SQL2K8R2-IE2\Jonathan Kehayias’.

Logging Extended Events changes to the ERRORLOG   TraceMessages
SQL Trace messages

However, for Extended Events nothing is logged when a user starts or stops an event session on the server. The question in class today was whether it was possible to make Extended Events log entries like SQL Trace and the answer is yes, with a DDL Trigger.

1
2
3
4
5
6
7
8
9
10
11
12
13
14
15
16
17
18
19
20
21
22
23
24
25
CREATE TRIGGER XEventLogging
ON ALL SERVER
FOR DDL_EVENT_SESSION_EVENTS
AS
BEGIN
    SET NOCOUNT ON;
    DECLARE @EventData XML = EVENTDATA();
    DECLARE @EventType NVARCHAR(256) = @EventData.value('(EVENT_INSTANCE/EventType)[1]', 'NVARCHAR(256)')
    DECLARE @SessionName NVARCHAR(256) = @EventData.value('(EVENT_INSTANCE/ObjectName)[1]', 'NVARCHAR(256)')
    DECLARE @LoginName NVARCHAR(256) = @EventData.value('(EVENT_INSTANCE/LoginName)[1]', 'NVARCHAR(256)')
    DECLARE @Command NVARCHAR(MAX) = @EventData.value('(EVENT_INSTANCE/TSQLCommand/CommandText)[1]', 'NVARCHAR(MAX)');
    DECLARE @msg NVARCHAR(440) = CASE
        WHEN @EventType = 'CREATE_EVENT_SESSION'
            THEN 'Extended Event session created. Session Name = ''%s''. Login Name = ''%s''.'
        WHEN @EventType = 'ALTER_EVENT_SESSION' AND LOWER(@Command) LIKE LOWER('%STATE%=%START%')
            THEN 'Extended Event session started. Session Name = ''%s''. Login Name = ''%s''.'
        WHEN @EventType = 'ALTER_EVENT_SESSION' AND LOWER(@Command) LIKE LOWER('%STATE%=%STOP%')
            THEN 'Extended Event session stopped. Session Name = ''%s''. Login Name = ''%s''.'
        WHEN @EventType = 'DROP_EVENT_SESSION'
            THEN 'Extended Event session dropped. Session Name = ''%s''. Login Name = ''%s''.'
        END

    RAISERROR(@msg, 10, 1, @SessionName, @LoginName) WITH LOG;
END
GO
Now anytime an event session is created, started, stopped, or dropped, information will be logged into the ERRORLOG file.

Logging Extended Events changes to the ERRORLOG   ExtendedEventsMessages
New Extended Events messages
Mapping wait types in dm_os_wait_stats to Extended Events
扩展事件的等待事件和dm_os_wait_stats视图里的等待事件匹配
--https://www.sqlskills.com/blogs/jonathan/mapping-wait-types-in-dm_os_wait_stats-to-extended-events/
A few months back I received an email from a member of the community that was trying to filter the sqlos.wait_info event for some of the wait types that are filtered out by Glenn’s diagnostic queries, and to their dismay wasn’t able to find the specific wait types in the wait_types map in sys.dm_xe_map_values.  This scenario is something that I have long known about but never actually blogged about, though this blog post has been sitting in draft form since early 2012.  Now that things have started to slow down at the end of this year I took a little time and built a spreadsheet of the wait_type names in sys.dm_os_wait_stats that don’t match exactly to the map_value in sys.dm_xe_map_values.

I’d like to thank Bob Ward at Microsoft for taking the time to double check the spreadsheet I originally built for this blog post for accuracy and for the corrections on a few of the wait types he provided.  The list of wait types below was generated from SQL Server 2012 Service Pack 1 + Cumulative Update 6.

wait_type in sys.dm_os_wait_stats

map_value in sys.dm_xe_map_values

ASYNC_NETWORK_IO    NETWORK_IO
BROKER_TASK_STOP    SSB_TASK_STOP
CLR_JOIN    CLR_TASK_JOIN
CLR_MEMORY_SPY    CLR_MEMORY_SPY_ACCESS
CREATE_DATINISERVICE    GET_DATINISERVICE
DBCC_SCALE_OUT_EXPR_CACHE    CHECK_EXPRESSION_CACHE
DBSTATE    DB_STATE
DLL_LOADING_MUTEX    DLL_LOAD
ERROR_REPORTING_MANAGER    ERROR_REPORTING_MGR
EXECUTION_PIPE_EVENT_INTERNAL    TWO_THREAD_PIPE_EVENT
FS_FC_RWLOCK    FS_GC_RWLOCK
FT_IFTS_RWLOCK    FT_RWLOCK
FT_IFTS_SCHEDULER_IDLE_WAIT    FT_SCHEDULER_IDLE_WAIT
FULLTEXT GATHERER    FULLTEXT_GATHERER
HADR_ARCONTROLLER_NOTIFICATIONS_SUBSCRIBER_LIST    HADR_ARPROXY_NOTIFICATION_SUBSCRIBER_LIST
HADR_DATABASE_FLOW_CONTROL    HADR_PARTNER_FLOW
HADR_DATABASE_VERSIONING_STATE    HADR_VERSIONING_STATE
HADR_DATABASE_WAIT_FOR_RESTART    __indexMUTEX_HADR_DATABASE_WAIT_FOR_RESTART
HADR_DATABASE_WAIT_FOR_TRANSITION_TO_VERSIONING    HADR_WAIT_FOR_TRANSITION_TO_VERSIONING
HADR_FILESTREAM_BLOCK_FLUSH    HADRFS_BLOCK_FLUSH
HADR_FILESTREAM_FILE_CLOSE    HADRFS_FILE_CLOSE
HADR_FILESTREAM_FILE_REQUEST    HADRFS_FILE_REQUEST
HADR_FILESTREAM_IOMGR    HADRFS_IOMGR
HADR_FILESTREAM_IOMGR_IOCOMPLETION    HADRFS_IOMGR_IOCOMPLETION
HADR_FILESTREAM_MANAGER    HADRFS_MANAGER
HADR_RECOVERY_WAIT_FOR_CONNECTION    __indexMUTEX_HADR_RECOVERY_WAIT_FOR_CONNECTION
HADR_RECOVERY_WAIT_FOR_UNDO    __indexMUTEX_HADR_RECOVERY_WAIT_FOR_UNDO
HADR_TRANSPORT_FLOW_CONTROL    HADR_TRANSPORT_FLOW
HTBUILD    HASH_TABLE_BUILD
HTREPARTITION    HASH_TABLE_REPARTITION
INTERNAL_TESTING
LAZYWRITER_SLEEP    LZW_SLEEP
MD_AGENT_YIELD    METADATA_AGENT_YIELD
MD_LAZYCACHE_RWLOCK    METADATA_LAZYCACHE_RWLOCK
MISCELLANEOUS    UNKNOWN
MSSEARCH    MSSEARCH_COM
PREEMPTIVE_FSRECOVER_UNCONDITIONALUNDO    PREEMPTIVE_FSRECOVER_CONDITIONALUNDO
PREEMPTIVE_OS_SQMLAUNCH    PREEMPTIVE_SQMLAUNCH
PWAIT_ALL_COMPONENTS_INITIALIZED    ALL_COMPONENTS_INITIALIZED
PWAIT_COOP_SCAN    COOP_SCAN
PWAIT_EVENT_SESSION_INIT_MUTEX    EVENT_SESSION_INIT_MUTEX
PWAIT_HADR_ACTION_COMPLETED    HADR_ACTION_COMPLETED
PWAIT_HADR_CHANGE_NOTIFIER_TERMINATION_SYNC    HADR_ARPROXY_NOTIFICATION_SUBSCRIBER_LIST
PWAIT_HADR_CLUSTER_INTEGRATION    HADR_CHANGE_NOTIFIER_TERMINATION_SYNC
PWAIT_HADR_FAILOVER_COMPLETED    HADR_CLUSTER_INTEGRATION
PWAIT_HADR_OFFLINE_COMPLETED    HADR_FAILOVER_COMPLETED
PWAIT_HADR_ONLINE_COMPLETED    HADR_OFFLINE_COMPLETED
PWAIT_HADR_POST_ONLINE_COMPLETED    HADR_ONLINE_COMPLETED
PWAIT_HADR_SERVER_READY_CONNECTIONS    HADR_SERVER_READY_CONNECTIONS
PWAIT_HADR_WORKITEM_COMPLETED    HADR_WORKITEM_COMPLETED
PWAIT_MD_LOGIN_STATS    MD_LOGIN_STATS
PWAIT_MD_RELATION_CACHE    MD_RELATION_CACHE
PWAIT_MD_SERVER_CACHE    MD_SERVER_CACHE
PWAIT_MD_UPGRADE_CONFIG    MD_UPGRADE_CONFIG
PWAIT_PREEMPTIVE_AUDIT_ACCESS_WINDOWSLOG    PREEMPTIVE_AUDIT_ACCESS_WINDOWSLOG
PWAIT_QRY_BPMEMORY    QRY_BPMEMORY
PWAIT_REPLICA_ONLINE_INIT_MUTEX    REPLICA_ONLINE_INIT_MUTEX
PWAIT_RESOURCE_SEMAPHORE_FT_PARALLEL_QUERY_SYNC    RESOURCE_SEMAPHORE_FT_PARALLEL_QUERY_SYNC
PWAIT_SECURITY_CACHE_INVALIDATION    SECURITY_CACHE_INVALIDATION
QUERY_EXECUTION_INDEX_SORT_EVENT_OPEN    QUERY_EXEC_INDEXSORT_OPEN
REDO_THREAD_PENDING_WORK    REDO_SIGNAL
REDO_THREAD_SYNC    REDO_SYNC
RESOURCE_GOVERNOR_IDLE
SCAN_CHAR_HASH_ARRAY_INITIALIZATION    SCAN_CHAR_HASH_ARRAY_INIT
SERVER_IDLE_CHECK    SERVER_IDLE_LOCK
SNI_LISTENER_ACCESS    LISTENER_UPDATE
SNI_TASK_COMPLETION    SNI_WAIT_TASK_FINISH
SP_PREEMPTIVE_SERVER_DIAGNOSTICS_SLEEP    PREEMPTIVE_SP_SERVER_DIAGNOSTICS_SLEEP
THREADPOOL    SOS_WORKER
TRAN_MARKLATCH_DT    TRANMARKLATCH_DT
TRAN_MARKLATCH_EX    TRANMARKLATCH_EX
TRAN_MARKLATCH_KP    TRANMARKLATCH_KP
TRAN_MARKLATCH_NL    TRANMARKLATCH_NL
TRAN_MARKLATCH_SH    TRANMARKLATCH_SH
TRAN_MARKLATCH_UP    TRANMARKLATCH_UP
VIA_ACCEPT    VIA_ACCEPT_DONE
WAIT_XTP_GUEST    XTP_GUEST
WAIT_XTP_TASK_SHUTDOWN    XTP_TASK_SHUTDOWN
WAIT_XTP_TRAN_COMMIT    XTP_TRAN_COMMIT
WAITFOR_TASKSHUTDOWN    TASKSHUTDOWN
XE_CALLBACK_LIST    XE_CALLBACK
XTPPROC_PARTITIONED_STACK_CREATE    __indexXTPPROC_PARTITIONED_STACK_CREATE