
【云计算】mesos+marathon 服务发现、负载均衡、监控告警方案
Mesos-dns 和 Marathon-lb 是mesosphere 官网提供的两种服务发现和负载均衡工具。官方的文档主要针对DCOS,针对其它系统的相关中文文档不多,下面是我在Centos7上的安装说明和使用总结。
1. Mesos服务发现与负载均衡
默认情况下,mesos marathon会把app发布到随机节点的随机端口上,当mesos slaves和app越来越多的时候,想查找某组app就变得困难。
mesos提供了两个工具:mesos-dns和marathon-lb。mesos-dns是一个服务发现工具,marathon-lb不仅是服务发现工具,还是负载均衡工具。
2. mesos-dns
Mesos-dns是 mesos 服务发现工具,能查找app的Ip,端口号以及master,leader等信息。
2.1 安装
从下述地址下载mesos-dns二进制文件:
https://github.com/mesosphere/mesos-dns/releases
重命名为mesos-dns
chmod +x mesos-dns
按照官方文档编写config.json,填入zk、master等相关信息
2.2 启动
2.2.1 命令行方式
mesos-dns -config config.json
2.2.2 也可以用marathon部署
#mesos-dns.json
{
"id": "mesos-dns",
"cpus": 0.5,
"mem": 128.0,
"instances": 3,
"constraints": [["hostname", "UNIQUE"]],
"cmd": "/opt/mesos-dns/mesos-dns -config /opt/mesos-dns/config.json"
}
#向marathon发送部署内容
curl -i -H 'Content-Type: application/json' 172.31.17.71:8080/v2/apps -d@mesos-dns.json
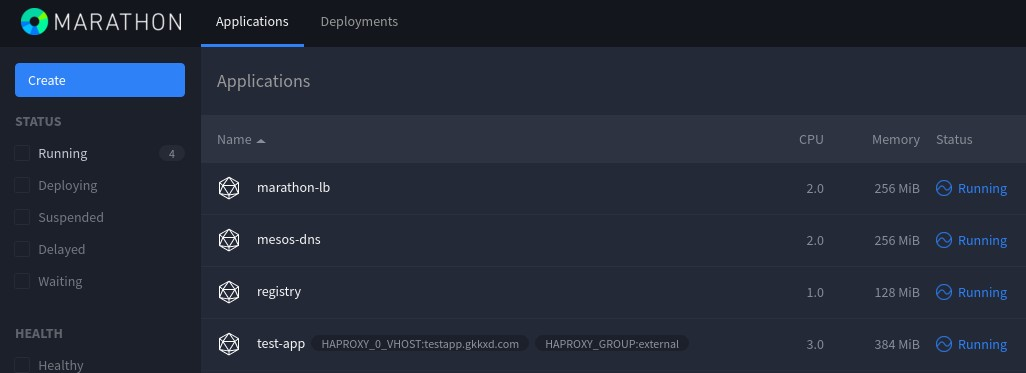
图中的mesos-dns是通过marathon部署的mesos-dns,共两个实例。
2.3 使用方法
注:slave4是安装了mesos-dns的主机名
2.3.1 查找app的ip
dig test-app.marathon.mesos +short @slave4
172.17.0.2
2.3.2 查找app所在节点的IP
dig test-app.marathon.slave.mesos +short @slave4
172.31.17.33
172.31.17.31
172.31.17.32
2.3.3 查找app服务端口号
dig SRV _test-app._tcp.marathon.mesos +short @slave4
0 0 31234 test-app-s3ehn-s11.marathon.slave.mesos.
0 0 31846 test-app-zfp5d-s10.marathon.slave.mesos.
0 0 31114 test-app-3xynw-s12.marathon.slave.mesos.
3. marathon-lb
Marathon-lb既是一个服务发现工具,也是负载均衡工具,它集成了haproxy,自动获取各个app的信息,为每一组app生成haproxy配置,通过servicePort或者web虚拟主机提供服务。
要使用marathonn-lb,每组app必须设置HAPROXY_GROUP标签。
Marathon-lb运行时绑定在各组app定义的服务端口(servicePort,如果app不定义servicePort,marathon会随机分配端口号)上,可以通过marathon-lb所在节点的相关服务端口访问各组app。
例如:marathon-lb部署在slave5,test-app 部署在slave1,test-app 的servicePort是10004,那么可以在slave5的 10004端口访问到test-app提供的服务。
由于servicePort 非80、443端口(80、443端口已被marathon-lb中的 haproxy独占),对于web服务来说不太方便,可以使用 haproxy虚拟主机解决这个问题:
在提供web服务的app配置里增加HAPROXY_{n}_VHOST(WEB虚拟主机)标签,marathon-lb会自动把这组app的WEB集群服务发布在marathon-lb所在节点的80和443端口上,用户设置DNS后通过虚拟主机名来访问。
3.1 安装
#下载marathon-lb镜像
docker pull docker.io/mesosphere/marathon-lb
可以通过docker run运行,也可以通过marathon部署到mesos集群里。
3.2 运行
3.2.1 命令行运行
docker run -d --privileged -e PORTS=9090 --net=host docker.io/mesosphere/marathon-lb sse -m http://master1_ip:8080 -m http://master2_ip:8080 -m http://master3_ip:8080 --group external
3.2.2 通过marathon部署
{
"id": "marathon-lb",
"instances": 3,
"constraints": [["hostname", "UNIQUE"]],
"container": {
"type": "DOCKER",
"docker": {
"image": "docker.io/mesosphere/marathon-lb",
"privileged": true,
"network": "HOST"
}
},
"args": ["sse", "-m","http://master1_ip:8080", "-m","http://master2_ip:8080", "-m","http://master3_ip:8080","--group", "external"]
}
curl -i -H 'Content-Type: application/json' 172.31.17.71:8080/v2/apps -d@marathon-lb.json
3.3 使用方法
下面使用marathon-lb对http服务进行服务发现和负载均衡:
3.3.1 发布app
# 先创建app的json配置信息
一定要加上HAPROXY_GROUP标签,对于web服务,可以加上VHOST标签,让marathon-lb设置WEB虚拟主机;
对于web服务,servicePort设置为0即可,marathon-lb会自动把web服务集群发布到80、443上;
{
"id": "test-app",
"labels": {
"HAPROXY_GROUP":"external",
"HAPROXY_0_VHOST":"test-app.XXXXX.com"
},
"cpus": 0.5,
"mem": 64.0,
"instances": 3,
"constraints": [["hostname", "UNIQUE"]],
"container": {
"type": "DOCKER",
"docker": {
"image": "httpd",
"privileged": false,
"network": "BRIDGE",
"portMappings": [
{ "containerPort": 80, "hostPort": 0, "servicePort": 0, "protocol": "tcp"}
]
}
}
}
#发布app
curl -i -H 'Content-Type: application/json' 172.31.17.71:8080/v2/apps -d@test-app.json
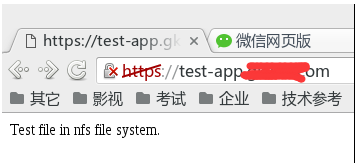
3.3.2 访问app
先设置DNS或者hosts文件:
172.31.17.34 test-app.XXXXX.com
用浏览器通过http和https访问虚拟主机,发现服务已经启动,实际上是marathon-lb内置的haproxy对test-app的三个实例配置的web服务集群:
对于marathon-lb,可以同时部署多台,然后用DNS轮询或者keepalived虚拟IP实现高可用。
前几天我在mesos平台上基于 cadvisor部署了 influxdb 和 grafana,用于监控 mesos 以及 docker app 运行信息,发现这套监控系统不太适合 mesos + docker 的架构,原因是:
1)mesos task id 和 docker container name 不一致
cadvisor 的设计基于 docker host,没有考虑到mesos 数据中心;
cadvisor 用 docker name(docker ps能看到)来标记抓取的数据,而 mesos 用 task id(在mesos ui 或者metrics里能看到) 来标记正在运行的任务。mesos task 的类型可以是 docker 容器,也可以是非容器。mesos task id 与docker container name 的命名也是完全不一样的。
上述问题导致 cadvisor 抓取到数据后,用户难以识别属于哪个 mesos task
2)cadvisor 和 grafana 不支持报警
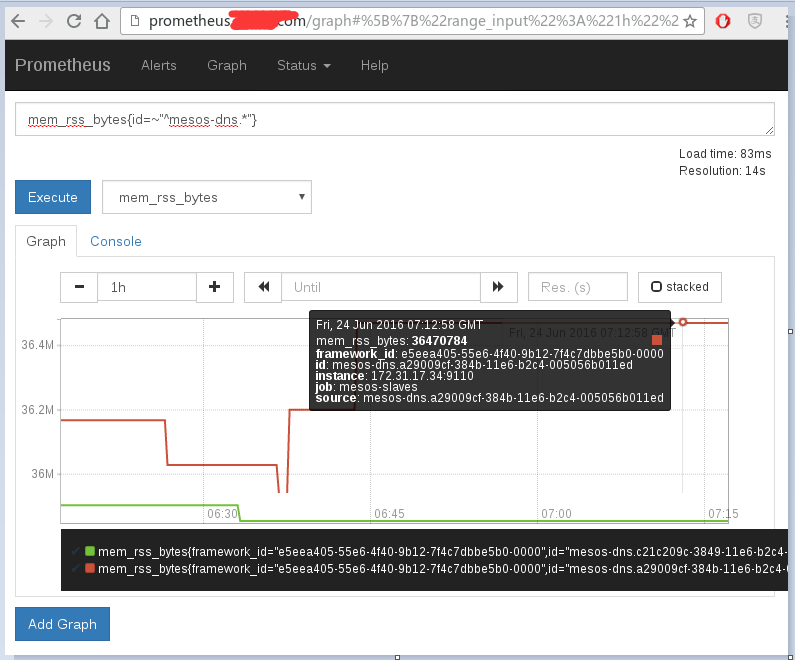
经过查询资料,发现 mesos-exporter + prometheus + alert-manager 是个很好的组合,可以解决上述问题:
mesos-exporter 是 mesosphere 开发的工具,用于导出 mesos 集群包括 task 的监控数据并传递给prometheus;prometheus是个集 db、graph、statistic 于一体的监控工具;alert-manager 是 prometheus 的报警工具
搭建方法:
1. build mesos-exporter
|
1
2
3
|
git clone https://github.com/mesosphere/mesos_exporter.gitcd mesos_exporterdocker build -f Dockerfile -t mesosphere/mesos-exporter . |
2. docker pull prometheus, alert-manager
3. 部署 mesos-exporter, alert-manager, prometheus
mesos-exporter:
|
1
2
3
4
5
6
7
8
9
10
11
12
13
14
15
16
17
18
19
20
21
22
23
24
25
26
27
28
|
{ "id": "mesos-exporter-slave", "instances": 6, "cpus": 0.2, "mem": 128, "args": [ "-slave=http://127.0.0.1:5051", "-timeout=5s" ], "constraints": [ ["hostname","UNIQUE"], ["hostname", "LIKE", "slave[1-6]"] ], "container": { "type": "DOCKER", "docker": { "image": "172.31.17.36:5000/mesos-exporter:latest", "network": "HOST" }, "volumes": [ { "containerPath": "/etc/localtime", "hostPath": "/etc/localtime", "mode": "RO" } ] }} |
请打开slave 防火墙的9110/tcp 端口
alert-manager:
|
1
2
3
4
5
6
7
8
9
10
11
12
13
14
15
16
17
18
19
20
21
22
23
24
25
26
27
28
29
30
31
32
33
34
35
36
37
38
39
40
41
|
{ "id": "alertmanager", "instances": 1, "cpus": 0.5, "mem": 128, "constraints": [ ["hostname","UNIQUE"], ["hostname", "LIKE", "slave[1-6]"] ], "labels": { "HAPROXY_GROUP":"external", "HAPROXY_0_VHOST":"alertmanager.XXXXX.com" }, "container": { "type": "DOCKER", "docker": { "image": "172.31.17.36:5000/alertmanager:latest", "network": "BRIDGE", "portMappings": [ { "containerPort": 9093, "hostPort": 0, "servicePort": 0, "protocol": "tcp" } ] }, "volumes": [ { "containerPath": "/etc/localtime", "hostPath": "/etc/localtime", "mode": "RO" }, { "containerPath": "/etc/alertmanager/config.yml", "hostPath": "/var/nfsshare/alertmanager/config.yml", "mode": "RO" }, { "containerPath": "/alertmanager", "hostPath": "/var/nfsshare/alertmanager/data", "mode": "RW" } ] }} |
prometheus:
|
1
2
3
4
5
6
7
8
9
10
11
12
13
14
15
16
17
18
19
20
21
22
23
24
25
26
27
28
29
30
31
32
33
34
35
36
37
38
39
40
41
42
43
44
45
46
47
48
|
{ "id": "prometheus", "instances": 1, "cpus": 0.5, "mem": 128, "args": [ "-config.file=/etc/prometheus/prometheus.yml", "-storage.local.path=/prometheus", "-web.console.libraries=/etc/prometheus/console_libraries", "-web.console.templates=/etc/prometheus/consoles", "-alertmanager.url=http://alertmanager.XXXXX.com" ], "constraints": [ ["hostname","UNIQUE"], ["hostname", "LIKE", "slave[1-6]"] ], "labels": { "HAPROXY_GROUP":"external", "HAPROXY_0_VHOST":"prometheus.XXXXX.com" }, "container": { "type": "DOCKER", "docker": { "image": "172.31.17.36:5000/prometheus:latest", "network": "BRIDGE", "portMappings": [ { "containerPort": 9090, "hostPort": 0, "servicePort": 0, "protocol": "tcp" } ] }, "volumes": [ { "containerPath": "/etc/localtime", "hostPath": "/etc/localtime", "mode": "RO" }, { "containerPath": "/etc/prometheus", "hostPath": "/var/nfsshare/prometheus/conf", "mode": "RO" }, { "containerPath": "/prometheus", "hostPath": "/var/nfsshare/prometheus/data", "mode": "RW" } ] }} |
4. prometheus 配置
prometheus.yml
|
1
2
3
4
5
6
7
8
9
10
11
12
13
14
15
16
17
18
19
20
21
22
23
24
25
|
# my global configglobal: scrape_interval: 15s # By default, scrape targets every 15 seconds. evaluation_interval: 15s # By default, scrape targets every 15 seconds. # scrape_timeout is set to the global default (10s). # Attach these labels to any time series or alerts when communicating with # external systems (federation, remote storage, Alertmanager). external_labels: monitor: 'codelab-monitor'# Load and evaluate rules in this file every 'evaluation_interval' seconds.rule_files: # - "first.rules" # - "second.rules"scrape_configs: - job_name: 'mesos-slaves' scrape_interval: 5s metrics_path: '/metrics' scheme: 'http' target_groups: - targets: ['172.31.17.31:9110', '172.31.17.32:9110', '172.31.17.33:9110', '172.31.17.34:9110', '172.31.17.35:9110', '172.31.17.36:9110'] - labels: group: 'office' |
待补充 ...
5. 报警设置
待补充 ...
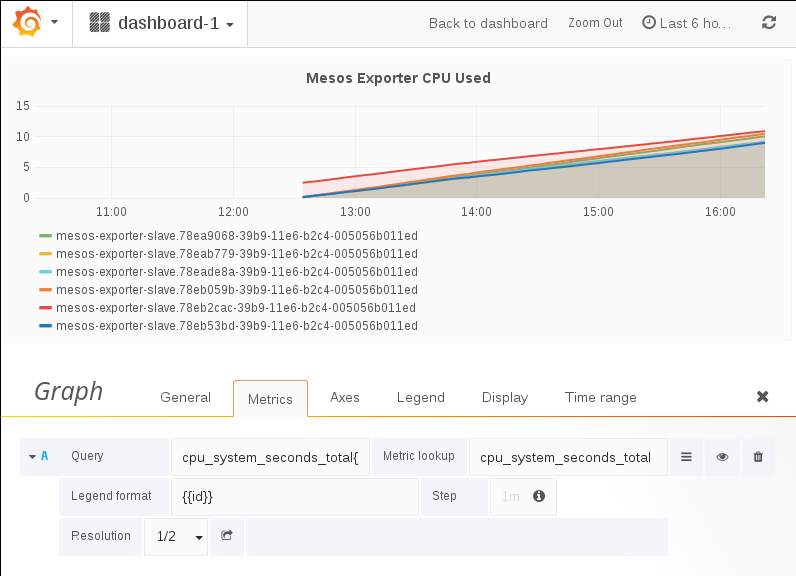
6. 与 grafana 集成
prometheus的 graph 功能不太完善,可以与 grafana 集成,让 grafana 承担 graph 功能。
data source 设置:

7. 附:mesos metrics 和 statics 地址
http://master1:5050/metrics/snapshot
http://slave4:5051/metrics/snapshot
http://master1:5050/master/state.json
http://slave4:5051/monitor/statistics.json
用户可以基于上述页面的数据,编写自己的监控程序。
参考资料:

