Dstl Satellite Imagery Feature Detection-Data Processing Tutorial
如何读取WKT格式文件
我们找到了这些有用的包:
Python - shapely.loads()
R - rgeos
如何读取geojson格式文件
我们找到了这些有用的包:
Python - json, geojson, shapely (使用json,然后将其转换成shapely的复杂多边形)
R - geojsonio
如何将几何投影到像素坐标
在我们提供的数据集中,我们创建了一组地理坐标,它们在x = [0,1]和y = [-1.0]的范围内。 这些坐标被变换,使得我们模糊卫星图像被拍摄的位置。 图像来自地球上相同的区域。
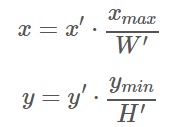
为了利用这些图像,我们提供每个图像的网格坐标,以便您知道如何缩放它们并将它们与像素的图像对齐。 在grid_sizes.csv中,给出每个imageId的Xmax和Ymin值。
对于每个图像,您应该能够从图像栅格获取宽度(W)和高度(H)。 对于3391 x 3349 x 3的3波段图像,W为3349,H为3391.然后可以按如下方式缩放数据:

如何将的你结果转为多边形
最好使用cascaded_union()将多边形列表展开为不重叠的多边形。
缩放结果回到原来的坐标:
然后就很容易使用shapely来输出多边形到wtk格式文件:mulitpoly.wkt
如何在Python中打开GeoTiff文件
GDAL功能强大但有点难安装。如果你想去用它读取栅格文件,tifffile是一个轻量的打开GeoTiff文件的包。
例如,下面的代码你能读取16波段的图像:


 1 import gdal
 2 from gdalconst import *
 3
 4 img_filename_16bandA = 'data/16band/6100_1_3_A.tif'
 5 img_filename_16bandM = 'data/16band/6100_1_3_M.tif'
 6 img_filename_16bandP = 'data/16band/6100_1_3_P.tif'
 7
 8 datasetA = gdal.Open(img_filename_16bandA, GA_ReadOnly )
 9 datasetM = gdal.Open(img_filename_16bandM, GA_ReadOnly )
10 datasetP = gdal.Open(img_filename_16bandP, GA_ReadOnly )
11
12 print 'Size is ',datasetA.RasterXSize,'x',datasetA.RasterYSize, \
13  'x',datasetA.RasterCount
14 print 'Size is ',datasetM.RasterXSize,'x',datasetM.RasterYSize, \
15  'x',datasetM.RasterCount
16 print 'Size is ',datasetP.RasterXSize,'x',datasetP.RasterYSize, \
17  'x',datasetP.RasterCount
输出:
Size is 136 x 134 x 8
Size is 848 x 837 x 8
Size is 3391 x 3348 x 1
或者你能属于tiffffile:
1 import tifffile as tiff
2 P = tiff.imread(img_filename_16bandP)
3 tiff.imshow(P)
打如何在R中打开Geo Tiff文件
感谢社区成员smota的提出:
1 library(raster)
2 raster_6044_4_4 <- raster("./data/three_band/6040_4_4.tif")
3 plot(raster_6044_4_4)
4 library(rgdal)
5 gdal_6044_4_4 <- readGDAL(paste0("./data/three_band/", '6040_4_4', ".tif"))
6 plot(gdal_6044_4_4)
处理图像:
 1 devtools::install_github("ropensci/geojsonio")
 2 library("geojsonio")
 3 install.packages("rgdal", type = "source")
 4 install.packages("rgeos", type = "source")
 5 library("rgdal")
 6 library("rgeos")
 7 library(ggplot2)
 8 grid_6010_4_4 <-geojson_read("./data/train_geojson/train_geojson/6010_4_4/Grid_6010.geojson", method = local, what= 'sp')
 9 plot(grid_6010_4_4)
10 ggplot(grid_6010_4_4, aes(long, lat, group = group)) + geom_polygon()
获得Docker?
这个dockerfile应该能对Python使用者有帮助。
---本文译自:https://www.kaggle.com/c/dstl-satellite-imagery-feature-detection/details/data-processing-tutorial