

C#自定义工业控件开发
转自阿凡卢原文C#自定义工业控件开发
由于工作需要,调研过一段时间的工业控制方面的“组态软件”(SCADA)的开发,组态软件常用于自动化工业控制领域,其中包括实时数据采集、数据储存、设备控制和数据展现等功能。其中工控组件的界面展现的实现类似于Windows系统下的各种开发控件,通过各种控件的组装,和硬件协议的集成,就可以实现对相应设备的控制和实时状态的显示。
每个对应的硬件UI展示都可以用一个自定义控件来实现,如下图的一个温度计,就可以使用UserControl来实现。
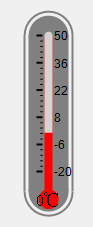
using System;
using System.Collections.Generic;
using System.ComponentModel;
using System.Drawing;
using System.Data;
using System.Linq;
using System.Text;
using System.Windows.Forms;

namespace HMIControls
{
    public partial class ThermometerControl : UserControl
    {
        /// <summary>
        /// 初始化控件
        /// 预设绘图方式:双缓冲、支持透明背景色、自定义绘制
        /// </summary>
        public ThermometerControl()
        {
            SetStyle(ControlStyles.AllPaintingInWmPaint, true);
            SetStyle(ControlStyles.OptimizedDoubleBuffer, true);
            SetStyle(ControlStyles.ResizeRedraw, true);
            SetStyle(ControlStyles.Selectable, true);
            SetStyle(ControlStyles.SupportsTransparentBackColor, true);
            SetStyle(ControlStyles.UserPaint, true);

            InitializeComponent();
        }

        // 温度
        private float temperature = 0;
        [Category("温度"), Description("当前温度")]
        public float Temperature
        {
            set { temperature = value; }
            get { return temperature; }
        }

        // 最高温度
        private float highTemperature = 50;
        [Category("温度"), Description("最高温度")]
        public float HighTemperature
        {
            set { highTemperature = value; }
            get { return highTemperature; }
        }

        // 最低温度
        private float lowTemperature = -20;
        [Category("温度"), Description("最低温度")]
        public float LowTemperature
        {
            set { lowTemperature = value; }
            get { return lowTemperature; }
        }

        // 当前温度数值的字体
        private Font tempFont = new Font("宋体", 12);
        [Category("温度"), Description("当前温度数值的字体")]
        public Font TempFont
        {
            set { tempFont = value; }
            get { return tempFont; }
        }

        // 当前温度数值的颜色
        private Color tempColor = Color.Black;
        [Category("温度"), Description("当前温度数值的颜色")]
        public Color TempColor
        {
            set { tempColor = value; }
            get { return tempColor; }
        }

        // 大刻度线数量
        private int bigScale = 5;
        [Category("刻度"), Description("大刻度线数量")]
        public int BigScale
        {
            set { bigScale = value; }
            get { return bigScale; }
        }

        // 小刻度线数量
        private int smallScale = 5;
        [Category("刻度"), Description("小刻度线数量")]
        public int SmallScale
        {
            set { smallScale = value; }
            get { return smallScale; }
        }

        // 刻度字体
        private Font drawFont = new Font("Aril", 9);
        [Category("刻度"), Description("刻度数字的字体")]
        public Font DrawFont
        {
            get { return drawFont; }
            set { drawFont = value; }
        }

        // 字体颜色
        private Color drawColor = Color.Black;
        [Category("刻度"), Description("刻度数字的颜色")]
        public Color DrawColor
        {
            set { drawColor = value; }
            get { return drawColor; }
        }

        // 刻度盘最外圈线条的颜色
        private Color dialOutLineColor = Color.Gray;
        [Category("背景"), Description("刻度盘最外圈线条的颜色")]
        public Color DialOutLineColor
        {
            set { dialOutLineColor = value; }
            get { return dialOutLineColor; }
        }

        // 刻度盘背景颜色
        private Color dialBackColor = Color.Gray;
        [Category("背景"), Description("刻度盘背景颜色")]
        public Color DialBackColor
        {
            set { dialBackColor = value; }
            get { return dialBackColor; }
        }

        // 大刻度线颜色
        private Color bigScaleColor = Color.Black;
        [Category("刻度"), Description("大刻度线颜色")]
        public Color BigScaleColor
        {
            set { bigScaleColor = value; }
            get { return bigScaleColor; }
        }

        // 小刻度线颜色
        private Color smallScaleColor = Color.Black;
        [Category("刻度"), Description("小刻度线颜色")]
        public Color SmallScaleColor
        {
            set { smallScaleColor = value; }
            get { return smallScaleColor; }
        }

        // 温度柱背景颜色
        private Color mercuryBackColor = Color.LightGray;
        [Category("刻度"), Description("温度柱背景颜色")]
        public Color MercuryBackColor
        {
            set { mercuryBackColor = value; }
            get { return mercuryBackColor; }
        }

        // 温度柱颜色
        private Color mercuryColor = Color.Red;
        [Category("刻度"), Description("温度柱颜色")]
        public Color MercuryColor
        {
            set { mercuryColor = value; }
            get { return mercuryColor; }
        }

        /// <summary>
        ///  变量
        /// </summary>
        private float X;
        private float Y;
        private float H;
        private Pen p, s_p;
        private Brush b;

        /// <summary>
        /// 绘制温度计
        /// </summary>
        /// <param name="sender"></param>
        /// <param name="e"></param>
        private void ThermometerControl_Paint(object sender, PaintEventArgs e)
        {
            // 温度值是否在温度表最大值和最小值范围内
            if (temperature > highTemperature)
            {
                //MessageBox.Show("温度值超出温度表范围,系统自动设置为默认值!");
                temperature = highTemperature;
            }
            if (temperature < lowTemperature)
            {
                temperature = lowTemperature;
            }

            e.Graphics.SmoothingMode = System.Drawing.Drawing2D.SmoothingMode.HighQuality;
            e.Graphics.TranslateTransform(2, 2);

            X = this.Width - 4;
            Y = this.Height - 4;

            // 绘制边框(最外边的框)
            p = new Pen(dialOutLineColor, 2);
            e.Graphics.DrawLine(p, 0, X / 2, 0, (Y - X / 2));
            e.Graphics.DrawLine(p, X, X / 2, X, (Y - X / 2));
            e.Graphics.DrawArc(p, 0, 0, X, X, 180, 180);
            e.Graphics.DrawArc(p, 0, (Y - X), X, X, 0, 180);

            // 绘制背景色
            X = X - 8;
            Y = Y - 8;
            b = new SolidBrush(dialBackColor);
            e.Graphics.TranslateTransform(4, 4);
            e.Graphics.FillRectangle(b, 0, X / 2, X, (Y - X));
            e.Graphics.FillEllipse(b, 0, 0, X, X);
            e.Graphics.FillEllipse(b, 0, (Y - X), X, X);

            // 绘制指示柱
            b = new SolidBrush(mercuryBackColor);
            e.Graphics.FillEllipse(b, X * 2 / 5, (X / 2 - X / 10), X / 5, X / 5);
            b = new SolidBrush(mercuryColor);
            e.Graphics.FillEllipse(b, X / 4, (Y - X * 9 / 16), X / 2, X / 2);
            e.Graphics.FillRectangle(b, X * 2 / 5, (X / 2 + 1), X / 5, (Y - X));

            // 在温度计底部,绘制当前温度数值
            b = new SolidBrush(tempColor);
            StringFormat format = new StringFormat();
            format.LineAlignment = StringAlignment.Center;
            format.Alignment = StringAlignment.Center;
            e.Graphics.DrawString((temperature.ToString() + "℃"), tempFont, b, X / 2, (Y - X / 4), format);

            // 绘制大刻度线,线宽为2
            // 绘制小刻度线,线宽为1
            // 绘制刻度数字,字体,字号,字的颜色在属性中可改
            p = new Pen(bigScaleColor, 2);                        // 设置大刻度线的颜色,线粗
            s_p = new Pen(smallScaleColor, 1);                      // 设置小刻度线的颜色,线粗
            SolidBrush drawBrush = new SolidBrush(drawColor);   // 设置绘制数字的颜色
            format.Alignment = StringAlignment.Near;            // 设置数字水平对齐为中间,垂直对其为左边
            // 计算要绘制数字的数值
            int interval = (int)(highTemperature - lowTemperature) / bigScale;
            int tempNum = (int)highTemperature;
            for (int i = 0; i <= bigScale; i++)
            {
                float b_s_y = X / 2 + i * ((Y - X - X / 2) / bigScale);       // 绘制大刻度线的垂直位置
                e.Graphics.DrawLine(p, X / 5, b_s_y, (X * 2 / 5 - 2), b_s_y); // 绘制大刻度线
                e.Graphics.DrawString(tempNum.ToString(), drawFont, drawBrush, X * 3 / 5, b_s_y, format);   // 绘制刻度数字
                tempNum -= interval;    // 计算下一次要绘制的数值

                // 绘制小刻度线
                if (i < bigScale)
                {
                    for (int j = 1; j < smallScale; j++)
                    {
                        float s_s_y = b_s_y + ((X / 2 + (i + 1) * ((Y - X - X / 2) / bigScale) - b_s_y) / smallScale) * j;
                        e.Graphics.DrawLine(s_p, (X * 3 / 10), s_s_y, (X * 2 / 5 - 2), s_s_y);
                    }
                }
            }

            // 计算当前温度的位置
            float L = Y - X * 3 / 2;
            H = L * (temperature - lowTemperature) / (highTemperature - lowTemperature);
            // 绘制当前温度的位置
            b = new SolidBrush(mercuryBackColor);
            e.Graphics.FillRectangle(b, X * 2 / 5, X / 2, X / 5, (L - H));
        }
 }
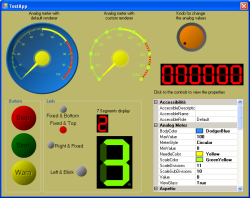
类似的一些实现,如下图:
对应一些动态线条的绘制,可以采用ZedGraph这个开源的控件来实现,如下图:
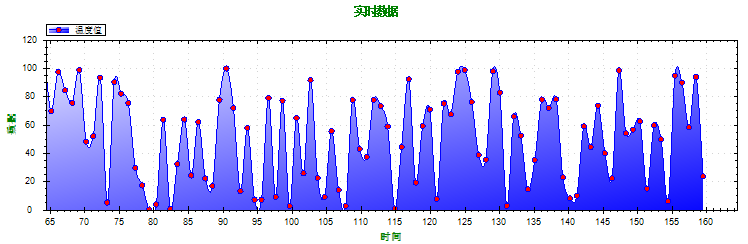
模拟的一些随时间变化的温度曲线图,一些参考代码如下:
using System;
using System.Collections.Generic;
using System.ComponentModel;
using System.Drawing;
using System.Data;
using System.Linq;
using System.Text;
using System.Windows.Forms;
using ZedGraph;

namespace HMIControls
{
    public partial class AirMachine : UserControl
    {
        private bool isValveOn;
        private Timer timer;
        private double temperature;
        private Random random = new Random();

        private Point arrowLocation1;
        private Point arrowLocation2;
        private Point arrowLocation3;

        // Starting time in milliseconds
        int tickStart = 0;

        public AirMachine()
        {
            InitializeComponent();
            InitUI();
        }

        private void InitUI()
        {
            isValveOn = false;
            this.labelTemperature.Text = "0";
            this.button1.Text = "开";
            this.button1.BackColor = Color.Snow;
            timer = new Timer();
            timer.Interval = 1000;
            timer.Tick += new EventHandler(timer_Tick);
            this.Load += new EventHandler(AirMachine_Load);

            this.labelArrow1.Visible = false;
            this.labelArrow2.Visible = false;
            this.labelArrow3.Visible = false;

            arrowLocation1 = this.labelArrow1.Location;
            arrowLocation2 = this.labelArrow2.Location;
            arrowLocation3 = this.labelArrow3.Location;

            this.button1.Click += new EventHandler(button1_Click);
        }

        private void CreateGraph()
        {
            zedGraphControl1.IsEnableZoom = false;
            zedGraphControl1.IsShowContextMenu = false;

            // Get a reference to the GraphPane
            GraphPane myPane = zedGraphControl1.GraphPane;

            // Set the titles
            myPane.Title.Text = "实时数据";
            myPane.YAxis.Title.Text = "数据";
            myPane.XAxis.Title.Text = "时间";

            // Change the color of the title
            myPane.Title.FontSpec.FontColor = Color.Green;
            myPane.XAxis.Title.FontSpec.FontColor = Color.Green;
            myPane.YAxis.Title.FontSpec.FontColor = Color.Green;


            // Save 1200 points.  At 50 ms sample rate, this is one minute
            // The RollingPointPairList is an efficient storage class that always
            // keeps a rolling set of point data without needing to shift any data values
            RollingPointPairList list = new RollingPointPairList(1200);

            // Initially, a curve is added with no data points (list is empty)
            // Color is blue, and there will be no symbols
            LineItem myCurve = myPane.AddCurve("温度值", list, Color.Blue, SymbolType.None);

            // Fill the area under the curves
            myCurve.Line.Fill = new Fill(Color.White, Color.Blue, 45F);

            myCurve.Line.IsSmooth = true;
            myCurve.Line.SmoothTension = 0.5F;

            // Increase the symbol sizes, and fill them with solid white
            myCurve.Symbol.Size = 8.0F;
            myCurve.Symbol.Fill = new Fill(Color.Red);
            myCurve.Symbol.Type = SymbolType.Circle;

            // Just manually control the X axis range so it scrolls continuously
            // instead of discrete step-sized jumps
            myPane.XAxis.Scale.Min = 0;
            myPane.XAxis.Scale.Max = 100;
            myPane.XAxis.Scale.MinorStep = 1;
            myPane.XAxis.Scale.MajorStep = 5;

            // Add gridlines to the plot
            myPane.XAxis.MajorGrid.IsVisible = true;
            myPane.XAxis.MajorGrid.Color = Color.LightGray;
            myPane.YAxis.MajorGrid.IsVisible = true;
            myPane.YAxis.MajorGrid.Color = Color.LightGray;

            // Scale the axes
            zedGraphControl1.AxisChange();

            // Save the beginning time for reference
            tickStart = Environment.TickCount;
        }

        void AirMachine_Load(object sender, EventArgs e)
        {
            CreateGraph();
        }

        private void UpdateZedGraph(double yValue)
        {
            // Make sure that the curvelist has at least one curve
            if (zedGraphControl1.GraphPane.CurveList.Count <= 0)
                return;

            // Get the first CurveItem in the graph
            LineItem curve = zedGraphControl1.GraphPane.CurveList[0] as LineItem;
            if (curve == null)
                return;

            // Get the PointPairList
            IPointListEdit list = curve.Points as IPointListEdit;
            // If this is null, it means the reference at curve.Points does not
            // support IPointListEdit, so we won't be able to modify it
            if (list == null)
                return;

            // Time is measured in seconds
            double time = (Environment.TickCount - tickStart) / 1000.0;

            // 3 seconds per cycle
            //list.Add(time, Math.Sin(2.0 * Math.PI * time / 3.0));
            list.Add(time, yValue);

            // Keep the X scale at a rolling 30 second interval, with one
            // major step between the max X value and the end of the axis
            Scale xScale = zedGraphControl1.GraphPane.XAxis.Scale;
            if (time > xScale.Max - xScale.MajorStep)
            {
                xScale.Max = time + xScale.MajorStep;
                xScale.Min = xScale.Max - 100.0;
            }

            // Make sure the Y axis is rescaled to accommodate actual data
            zedGraphControl1.AxisChange();
            // Force a redraw
            zedGraphControl1.Invalidate();
        }

        private void UpdataArrowPosition()
        {
            this.labelArrow1.Location = new Point(this.labelArrow1.Location.X + 30, this.labelArrow1.Location.Y);
            if (this.labelArrow1.Location.X >= this.panelPic.Location.X + this.panelPic.Width)
            {
                this.labelArrow1.Location = arrowLocation1;
            }

            this.labelArrow2.Location = new Point(this.labelArrow2.Location.X + 30, this.labelArrow2.Location.Y);
            if (this.labelArrow2.Location.X >= this.panelPic.Location.X + this.panelPic.Width)
            {
                this.labelArrow2.Location = arrowLocation2;
            }

            this.labelArrow3.Location = new Point(this.labelArrow3.Location.X + 30, this.labelArrow3.Location.Y);
            if (this.labelArrow3.Location.X >= this.panelPic.Location.X + this.panelPic.Width)
            {
                this.labelArrow3.Location = arrowLocation3;
            }
        }

        void timer_Tick(object sender, EventArgs e)
        {
            temperature = random.NextDouble() * 100;
            this.labelTemperature.Text = Convert.ToInt32(temperature).ToString();

            UpdateZedGraph(temperature);

            UpdataArrowPosition();
        }

        private void button1_Click(object sender, EventArgs e)
        {
            isValveOn = !isValveOn;
            if (isValveOn)
            {
                timer.Start();
                this.button1.Text = "关";
                this.button1.BackColor = Color.LawnGreen;
                this.labelTemperature.BackColor = Color.LawnGreen;
                this.labelArrow1.Visible = isValveOn;
                this.labelArrow2.Visible = isValveOn;
                this.labelArrow3.Visible = isValveOn;
            }
            else
            {
                timer.Stop();
                this.button1.Text = "开";
                this.button1.BackColor = Color.Snow;
                this.labelTemperature.Text = "0";
                this.labelTemperature.BackColor = Color.Snow;
                this.labelArrow1.Visible = isValveOn;
                this.labelArrow2.Visible = isValveOn;
                this.labelArrow3.Visible = isValveOn;
            }
        }
    }
}
整个组态软件的开发,从底层硬件相关的设备协议到上层的展现都是比较有难度的,特别是现在硬件协议不统一,业界没有统一的标准,虽然有OPC和BACnet等一些标准协议,但是在实际项目中,有很多的设备是没有实现OPC的,都是自己的私有协议,要基于这类的硬件做二次开发,需要向商家买协议,这也是成本的问题。
代码下载:http://download.csdn.net/detail/luxiaoxun/8256371
组态界面开发的一些参考资源:
http://www.codeproject.com/Articles/36116/Industrial-Controls
http://www.codeproject.com/Articles/17559/A-fast-and-performing-gauge
http://dashboarding.codeplex.com/
你们的评论、反馈,及对你们有所用,是我整理材料和博文写作的最大的鼓励和唯一动力。欢迎讨论和关注!
没有整理与归纳的知识,一文不值!高度概括与梳理的知识,才是自己真正的知识与技能。 永远不要让自己的自由、好奇、充满创造力的想法被现实的框架所束缚,让创造力自由成长吧! 多花时间,关心他(她)人,正如别人所关心你的。理想的腾飞与实现,没有别人的支持与帮助,是万万不能的。
没有整理与归纳的知识,一文不值!高度概括与梳理的知识,才是自己真正的知识与技能。 永远不要让自己的自由、好奇、充满创造力的想法被现实的框架所束缚,让创造力自由成长吧! 多花时间,关心他(她)人,正如别人所关心你的。理想的腾飞与实现,没有别人的支持与帮助,是万万不能的。

