redmine在linux上的mysql性能优化方法与问题排查方案
iredmine的linux服务器mysql性能优化方法与问题排查方案
问题定位:
客户端工具:
1. 浏览器inspect-tool的network timing工具分析
2. 浏览器查看 response header, 分析http server 与 web server.
服务器工具:
0. nmon 查看各类系统负载, rrdtool 查看网络状况。
1. uptime看cpu负载; free看内存; mem ; cat /proc/meminfo以及 iostat(sysstat)看IO / iotop看个体IO; sar dstat看全局。
2. pidstat -d -p 1234 1 1000 ; -d 用于查看IO, -r用于report page faults,-u用于查看cpu; -p 指定监控的进程 ,最后的数字是 interval 和 counts
3. iostat -d -x -k 1 10 #查看设备使用率(%util)、响应时间(await)
命令: iostat -m -x 1 1000 可以观察对应的CPU中的%iowait数据,除此之外iostat还提供了一些更详细的I/O状态数据,比如比较重要的有:
avgqu-sz : The average queue length of the requests that were issued to the device. (磁盘队列的请求长度,正常的话2,3比较好。可以和cpu的load一样的理解)
await : The average time (in milliseconds) for I/O requests issued to the device to be served. (代表一个I/O操作从wait到完成的总时间)
svctm和%util都是代表处理该I/O请求花费的时间和CPU的时间比例。 判断是否瓶颈时,这两个参数不是主要的
r/s w/s 和 rMB/s wMB/s 都是代表当前系统处理的I/O的一些状态,前者是我们常说的tps,后者就是吞吐量。这也是评价一个系统的性能指标
4. iotop -p xxx -n 100 -d 3 # 查看特定pid的 io, 并指定-d 延迟 和 -n 刷新次数
5. dstat --disk --mem --proc --io --sys --filesystem --tcp --vm --output dstat.csv 将各项数据信息统计,并写入 dstat.csv中。
1. 更方便的: ./dstat_mysql_io.sh -t -df --disk-util --disk --mem --proc --top-cpu --top-latency --top-bio --io --sys --filesystem --tcp --vm --output dstat.csv
可以直接查看-t: 当前时间, top block io 和 top cpu ,以及 top latency的程序,对分析IO瓶颈 cpu负载 各个硬盘的读写 非常方便。
2. dstat --mysql-io 利用/usr/share/dstat中的python扩展脚本,可以通过driver查看mysql的io状态,前提是需要安装python-mysqldb的接口。
3. dstat : dstat -cmsdnl -D sda > dstat_test.log 可以指定某个磁盘的状态。
4. 命令:dstat -y --tcp 1 1000 通过dstat --tcp可以比较方便的看到当前的tcp的各种状态,不需要每次netstat -nat去看。
6. sar命令监控全设备指标, 如 -u代表cpu, -b代表IO, -r 代表内存和交换空间,还可以自动将数据保存下来 -o:保存到指定文件名,-f:加载指定文件数据, 最后,还有两个参数分别表示 interval 和 count, 如: sar -b -o sarIO.log 1 100 . 意思就是每秒1次的频率循环100次 监控IO数据 并保存到sarIO.log文件中。
7. 观察系统部件10分钟,并对数据进行排序: sar -o temp 60 10
8. 如何确定swap分区与mysql DB data 在同一个磁盘上? 如果在同一个磁盘会产生swap 时 与 mysql 争抢 磁盘IO.
9. iostat 与 iotop 、 dstat、sar 分别统计的是哪一个层级的IO数据? linux系统io原理是如何? cache原理是如何?
10. top在多核系统中 cpu% 是如何计算的?mysql是否可以设置使用多核运行? 还是只能运行在单核?
命令:线程跟踪: top -Hp pid 可以实时的跟踪并获取指定进程中最耗cpu的线程。 再用前面的方法提取到对应的线程堆栈信息。
iotop 中的TID 也是指线程。
11. pidstat -p pid -u -d -t -w -h 1 1000 相当实用的一个命令,可以基于当个进程分析对应的性能数据,包括CPU,I/O,IR , CS等,可以方便开发者更加精细化的观察系统的运行状态。不过pidstat貌似是在2.6内核的一些较新的版本才有,需要安装sysstat包。
ubuntu下,可以通过sudo apt-get install sysstat进行安装。
12. mpstat -P ALL 1 1000 查看显示各cpu的使用状况,iowait与 user /sys 结合可以分析出。
注意一下这里面的%iowait列,CPU等待I/O操作所花费的时间。这个值持续很高通常可能是I/O瓶颈所导致的。
通过这个参数可以比较直观的看出当前的I/O操作是否存在瓶颈
13. netstat -nltp 查看端口链接以及对应进程信息
14. lsof -i: 80 可以查看指定端口占用进程。
lsof -p pid 可以查看指定pid的进程占用的资源。
15. atop 监视系统cpu irq 和 IO子系统, 并可以提供周期性采集并保存数据称日志供以后分析。
This isn't strictly answering your question, but you might find atop more useful. It can run as a daemon and write to a binary log file. The file contains all data necessary to reproduce what would have been seen had atop been run 'live'.
To run atop as a daemon, you could kick it off as
/usr/bin/atop -a -w /var/log/atop.log 60
to write a snapshot to the log every 60 seconds. Later you can see what was going on at a specific time by doing e.g.
atop -r /var/log/atop.log -b 10:00
to start at 10am. You can then step backwards and forwards throught the log to see how system activity developed.
To address your specific question of disk activity, pressing d while in atop will sort processes by their total disk activity at that point in time, and in the summary at the top of the screen you'll be able to see aggregated per-device statistics.
16. mysql 数据库大小 #查看数据库的大小,单位MByte
root@iRedmine:/redmine/mysql/bin# ./mysql -uroot -p1111 -e 'select table_schema,round(sum(data_length+index_length)/1024/1024,1) from information_schema.tables group by table_schema;'
+--------------------+--------------------------------------------------+
| table_schema | round(sum(data_length+index_length)/1024/1024,1) |
+--------------------+--------------------------------------------------+
| bitnami_redmine | 563.6 |
| information_schema | 0.0 |
| mysql | 0.6 |
| performance_schema | 0.0 |
+--------------------+--------------------------------------------------+
17. mysql数据库的基本状态 mysqladmin status
./mysqladmin -uroot -p1111 status
18. mysql数据库的详细状态 mysqladmin extended-status
./mysqladmin -uroot -p1111 status
19. mysql有一个有名的tuning-primer.sh
20. mycheckpoint 工具
下载: wget https://mycheckpoint.googlecode.com/files/mycheckpoint-231.tar.gz
使用方法如下:
1. 创建表 create database mycheckpoint;
2. 授权
GRANT ALL PRIVILEGES ON mycheckpoint.* TO 'root'@'localhost' IDENTIFIED BY '1111';
3. 初始化
mycheckpoint --host=127.0.0.1 --port=3306 --user=root --password=1111 --socket=/redmine/mysql/tmp/mysql.sock --database=mycheckpoint
4. 启动http服务器查看
mycheckpoint --host=127.0.0.1 --port=3306 --user=root --password=1111 --socket=/redmine/mysql/tmp/mysql.sock --database=mycheckpoint http
* * * * * /usr/local/bin/mycheckpoint --user=root --password=1111 --socket=/redmine/mysql/tmp/mysql.sock --database=mycheckpoint
21. percona-toolkit 工具
1. ./pt-index-usage --socket /redmine/mysql/tmp/mysql.sock --user root --password 1111
22. 如何开启慢查询自动Log功能,以及如何分析慢查询? 使用percona-toolkit
1.方法一: 修改 my.conf
2. 在mysql控制台使用 set variable
23. 监视影响 MySQL 性能的主要指标。如查询缓存命中率,Key_buffer_read_hits,Key_buffer_write_hits,Thread_cache_hits,Key_blocks_used_rate,Created_tmp_disk_tables_rate等信息,根据相关性能指标可以对服务器核心参数进行调整优化。
24. 磁盘工具: du -chd 1 表示只看当前目录下深度为1 的各个文件夹的大小。
25. 使用mysqltuner.pl进行状态监测与 性能调优建议。
1. wget http://mysqltuner.pl/ -O mysqltuner.pl
2. perl mysqltuner.pl
在运行iredmine服务器上面运行后, 获得如下建议:
root@iRedmine:~/performanceLog# export PATH=$PATH:/redmine/mysql/bin/
root@iRedmine:~/performanceLog# echo $PATH
/usr/local/sbin:/usr/local/bin:/usr/sbin:/usr/bin:/sbin:/bin:/usr/games:/redmine/mysql/bin/
root@iRedmine:~/performanceLog# perl mysqltuner.pl
perl: warning: Setting locale failed.
perl: warning: Please check that your locale settings:
LANGUAGE = "en_US:en",
LC_ALL = (unset),
LC_PAPER = "zh_CN.UTF-8",
LC_ADDRESS = "zh_CN.UTF-8",
LC_MONETARY = "zh_CN.UTF-8",
LC_NUMERIC = "zh_CN.UTF-8",
LC_TELEPHONE = "zh_CN.UTF-8",
LC_IDENTIFICATION = "zh_CN.UTF-8",
LC_MEASUREMENT = "zh_CN.UTF-8",
LC_TIME = "zh_CN.UTF-8",
LC_NAME = "zh_CN.UTF-8",
LANG = "en_US.UTF-8"
are supported and installed on your system.
perl: warning: Falling back to the standard locale ("C").
>> MySQLTuner 1.4.0 - Major Hayden <major@mhtx.net>
>> Bug reports, feature requests, and downloads at http://mysqltuner.com/
>> Run with '--help' for additional options and output filtering
Please enter your MySQL administrative login: root
Please enter your MySQL administrative password:
[OK] Currently running supported MySQL version 5.5.32
[OK] Operating on 64-bit architecture
-------- Storage Engine Statistics -------------------------------------------
[--] Status: +ARCHIVE +BLACKHOLE +CSV -FEDERATED +InnoDB +MRG_MYISAM
[--] Data in InnoDB tables: 371M (Tables: 92)
[--] Data in PERFORMANCE_SCHEMA tables: 0B (Tables: 17)
[!!] Total fragmented tables: 92
-------- Security Recommendations -------------------------------------------
[!!] User '@localhost' has no password set.
[!!] User '@ubuntu-12' has no password set.
-------- Performance Metrics -------------------------------------------------
[--] Up for: 8d 8h 26m 44s (59M q [81.922 qps], 4K conn, TX: 185B, RX: 11B)
[--] Reads / Writes: 99% / 1%
[--] Total buffers: 168.0M global + 2.8M per thread (151 max threads)
[OK] Maximum possible memory usage: 583.2M (0% of installed RAM)
[OK] Slow queries: 0% (396/59M)
[OK] Highest usage of available connections: 9% (15/151)
[OK] Key buffer size / total MyISAM indexes: 8.0M/102.0K
[OK] Key buffer hit rate: 100.0% (112M cached / 89 reads)
[!!] Query cache is disabled
[OK] Sorts requiring temporary tables: 0% (1K temp sorts / 3M sorts)
[!!] Joins performed without indexes: 2484
[!!] Temporary tables created on disk: 39% (1M on disk / 4M total)
[!!] Thread cache is disabled
[!!] Table cache hit rate: 3% (404 open / 12K opened)
[OK] Open file limit used: 6% (71/1K)
[OK] Table locks acquired immediately: 99% (92M immediate / 92M locks)
[!!] InnoDB buffer pool / data size: 128.0M/371.4M
[OK] InnoDB log waits: 0
-------- Recommendations -----------------------------------------------------
General recommendations:
Run OPTIMIZE TABLE to defragment tables for better performance
Adjust your join queries to always utilize indexes
When making adjustments, make tmp_table_size/max_heap_table_size equal
Reduce your SELECT DISTINCT queries without LIMIT clauses
Set thread_cache_size to 4 as a starting value
Increase table_open_cache gradually to avoid file descriptor limits
Read this before increasing table_open_cache over 64: http://bit.ly/1mi7c4C
Variables to adjust:
query_cache_size (>= 8M)
join_buffer_size (> 128.0K, or always use indexes with joins)
tmp_table_size (> 16M)
max_heap_table_size (> 16M)
thread_cache_size (start at 4)
table_open_cache (> 800)
innodb_buffer_pool_size (>= 371M)
另外还有: thread_concurrency = 32; (cpu*2)
26. mysql 针对请求的执行逻辑,影响到性能的关键指标:
参考: https://files.cnblogs.com/files/ToDoToTry/mysqlio-120511033204-phpapp02.pptx
参考: 系统各组件的吞吐量, http://blog.yufeng.info/archives/category/linux_kb/page/13
参考: 数据库访问性能优化法则: http://blog.csdn.net/yzsind/article/details/6059209
27. wget 的使用
1. 保存cookie: --save-cookies filename
wget --save-cookies cookies.txt \
--post-data 'user=foo&password=bar' \
http://server.com/auth.php
2. 使用cookie : --load-cookies filename
wget --load-cookies=cookie -p http://localhost:8080/issues/48575
3. 保存结果到指定文件: -O filename
wget http://localhost:8080/issues/48575 -O foo.html
4. 登陆post User password
# Log in to the server. This can be done only once.
wget --save-cookies cookies.txt --post-data 'user=foo&password=bar' http://server.com/auth.php
5. 包含hidden位的wget登陆脚本:
#!/bin/sh
# get the login page to get the hidden field data
wget -a log.txt -O loginpage.html http://foobar/default.aspx
hiddendata=`grep value < loginpage.html | grep foobarhidden | tr '=' ' ' | awk '{print $9}' | sed s/\"//g`
rm loginpage.html
# login into the page and save the cookies
postData=user=fakeuser'&'pw=password'&'foobarhidden=${hiddendata}
wget -a log.txt -O /dev/null --post-data ${postData} --keep-session-cookies --save-cookies cookies.txt http://foobar/default.aspx
# get the page your after
wget -a log.txt -O results.html --load-cookies cookies.txt http://foobar/lister.aspx?id=42
rm cookies.txt
28. ab测试:
1.指定header
ab -n 100 -H "Cookie: Key1=Value1; Key2=Value2" http://localhost:8080/issues/48575
2.指定cookie
ab -n 10000 -c 50 -g n10k_50c -C '_redmine_session="e66011c9"' http://localhost:8080/issues/48575
3.
29. http_load
30. webbench
31. siege url
32. curl_loader
ab测试时,即使使用了cookie来伪装已登陆用户,也总是被iredmine服务器开启了csrf拒绝服务,转向到login页面,解决方法:
1.找到redmine发布的代码中controller目录下的ApplicationController.rb文件,将其中的csrf保护函数protect_from_forgery中cookie.delete(auto_cookie_name)行注释掉。代码如下:
class ApplicationController < ActionController::Base
include Redmine::I18n
include Redmine::Pagination
include RoutesHelper
helper :routes
class_attribute :accept_api_auth_actions
class_attribute :accept_rss_auth_actions
class_attribute :model_object
layout 'base'
protect_from_forgery
def handle_unverified_request
super
#cookies.delete(autologin_cookie_name)
end
before_filter :session_expiration, :user_setup, :check_if_login_required, :set_localization
rescue_from ActionController::InvalidAuthenticityToken, :with => :invalid_authenticity_token
rescue_from ::Unauthorized, :with => :deny_access
rescue_from ::ActionView::MissingTemplate, :with => :missing_template
include Redmine::Search::Controller
include Redmine::MenuManager::MenuController
helper Redmine::MenuManager::MenuHelper
def session_expiration
if session[:user_id]
if session_expired? && !try_to_autologin
reset_session
flash[:error] = l(:error_session_expired)
redirect_to signin_url
else
#session[:atime] = Time.now.utc.to_i
end
end
end
33. passenger的配置放在了apache2.conf文件中:
1. Passenge# PassengerMaxPoolSize
# Default: 6
# For 2gb RAM: 30
# For 256 slice with MySQL running: 2
PassengerMaxPoolSize 2
# PassengerPoolIdleTime
# Recommended to be avg time per page * 2
# In Google Analytics... (Avg time on site / Avg page views) * 2
# Default: 300
PassengerPoolIdleTime 150
MaxPoolSize 2
RAM (MB) PassengerMaxPoolSize
256 2
512 6 (default)
1024 (1GB) 15
2048 (2GB) 30
34. puma 安装
mysql2 C语言扩展: export JRUBY_OPTS="--1.9 -Xcext.enabled=true"
puma的多workers 多threads 的启动
puma -w 4 -t 32 -p 8080 -e production /redmine/apps/redmine/htdocs/config.ru
35. innodb的memcached plugin, 与 mysql + native memcached 配置,使用,coding时的要点。
36. mysql读写分离 设计方案, coding方案
37. orztop 查看mysql实时当前运行的sql语句的工具, 需要安装perl库依赖: readkey。
安装依赖: sudo apt-get install libdbi-perl
sudo apt-get install libdbd-mysql-perl
sudo apt-get install libterm-readkey-perl
或者通过cpan下载安装需要的安装perl库依赖: readkey。
38. 分析查看当前运行的sql语句: show processlist/show full processlist抓取sql
39. orzdba 查看所有mysql性能信息:svn co http://code.taobao.org/svn/orzdba/trunk
40. 如何预估mysql在产品环境下的性能?:
1. 使用orztop| tee currentSQL.log 来记录下一个url请求对应的sql语句
2. 找到currentSQL.log中记录下的sql语句,这些都是实际请求中执行的sql, 复制一下。
3. 将上一步复制的sql语句贴入到phpmyadmin当中执行,勾选profiling。
4. 观察结果,可以看到上述sql语句的精确耗时。 再用1s去除以耗时。
5. 同时,如果打开了open-table等较大,cache命中率较高,实际环境中可能比试验环境更高的性能。
41. 确定mysql的IO操作究竟在PageIO,还是sync 到文件IO, 多少次。 操作了哪个文件,是lseek随机操作 ,还是顺序操作。
42. 通过log目录下的production.log可以看到每次请求中,render页面 和 active-record分别占用了多长时间。
由于rails默认开启了rack, Rails::Rack::Logger, 会将http访问的 页面渲染Render 和 active-record耗时记录下来,如果是develop模式记录的东西更多,甚至包括sql语句都会打印出来,这将会极度地拖慢服务器效率。 所以,让puma或者passenger以production模式运行,并关闭Rails::Rack::Logger , rack::timer会提升很多性能。
43.如何关闭rails的middleware,
1. 使用rack middleware 查看当前使用的middleware,
2. 在以下文件中添加代码,手动删除不需要的,或者是对性能损耗大的middleware。
# config/application.rb
config.middleware.delete "Rack::MethodOverride"
44. 如何让puma以production模式运行服务器?
1. puma -w 4 -t 6 -p 8088 -e production /redmine/apps/redmine/htdocs/config.ru
2.
45. 如何关闭logger
46. 3.2.13版的rails的log中可以看到render页面耗时非常高,如下:
Rendered issues/show.html.erb within layouts/base (301.4ms)
Completed 200 OK in 557ms (Views: 336.7ms | ActiveRecord: 62.1ms)
原因:
1. 开启了assets.debug
2. 开启了assets.raise_runtime_errors
3. 3.2.13版的bug
解决办法:
1.
You can leave config.assets.debug = true but should disable new assets verification feature
# Adds additional error checking when serving assets at runtime.
# Checks for improperly declared sprockets dependencies.
# Raises helpful error messages.
config.assets.raise_runtime_errors = false
Solution with config.assets.debug disabled only works because it compiles assets once and assets are verified once. Assets verification is where the most of the time is spent.
2.
If you're coming from rails 3.2.13 note that a bunch of people have experienced this issue and reverting to 3.2.12 seems to resolve it. You can find more info here on github.
In my case disabling config.assets.debug sped things up a little, but reverting to 3.2.12 dropped request time from around 4 seconds to around 250ms.
进过再次考察,发现rails的Render速度就是这个数量级的,确实需要200ms左右。 妈蛋!
47. oprofile 非常强大的工具,1. 查看系统使用,2. 查看特定进程中各个函数使用率。
48. Gprof 是 Linux 下一个强有力的程序分析工具。对于 C 、 Pascal 或者 Fortran77 语言的程序,它能够以“ 日志”的形式记录程序运行时的统计信息:程序运行中各个函数消耗的时间和函数调用关系,以及每个函数被调用的次数等 , 还可以显示“注释的源代码”,是程序源代码的一个复本,标记有程序中每行代码的执行次数。
程序分析是以某种语言书写的程序为对象,对其内部的运作流程进行分析。
gpro f 是 gnu binutils 工具之一,默认情况下 linux 系统当中都带有这个工具。
使用 -pg 选项来编译 hello.c ,如果要得到带注释的源码清单,则需要增加 -g 选项。运行:
gcc -pg -g -o hello hello.c
运行应用程序: ./hello 会在当前目录下产生 gmon.out 文件
使用 gprof 来分析 gmon.out 文件,需要把它和产生它的应用程序关联起来:
gprof hello gmon.out -p 得到每个函数占用的执行时间
gprof hello gmon.out -q 得到 call graph ,包含了每个函数的调用关系,调用次数,执行时间等信息。
gprof hello gmon.out -A 得到一个带注释的“源代码清单”,它会注释源码,指出每个函数的执行次数。这需要在编译的时候 增加 -g 选项。
用 gprof 程序分析应用程序生成的数据时:如果内容太多,一屏显示不过来,可以通过 more/less 来分屏显示。
gprof -b hello gmon.out | less
49. zoom是一个类似与oprofile 但是提供了类似mac osx 上shark的GUI界面。
50. 阿里巴巴的myrelay 是一个优秀的 mysql 异步代理, 事件驱动,非阻塞。
mysql的代理,支持如下特性:
采用事件驱动、异步、非阻塞的设计模式,性能优秀
采用mysql原生协议,对应用层透明
支持mysql读写分离
提供mysql连接池管理
支持mysql冗余、健康检查
提供mysql的查询日志,方便对应用层进行分析
支持mysql配置动态加载
C语言实现
二、 应用场景
Mysql数据库集群访问,负载均衡、冗余、健康检查等
Mysql读写分离
三、 性能
优秀。一般应用通过代理访问数据库的性能将达到直连数据库性能的95%
四、 安装
通过svn下载源码
编译库文件
cd oplib/src/ && make install
编译程序
make install
创建目录
mkdir -p /home/admin/myrelay
mkdir -p /home/admin/myrelay/bin
mkdir -p /home/admin/myrelay/conf
mkdir -p /home/admin/myrelay/lib
cp myrelay /home/admin/myrelay/bin
cp conf/* /home/admin/myrelay/conf/
cp oplib/lib/oplib.so /home/admi/myrelay/lib/
五、 执行
配置LD_LIBRARY_PATH环境变量,让程序能够找到库文件
例如: export LD_LIBRARY_PATH="/home/admin/myrelay/lib"
执行程序
cd /home/admin/myrelay/bin && ./myrelay ../conf/myrelay.conf
51. 指标收集: collectd
52.指标收集: statsd(statsite)
53. 指标绘图 graphite
54. 监控、报警自动化: nagios / cacti /ganglia、zabbix
1. nagios,优势:报警的及时性和web界面的显示
劣势:配置相对比较繁琐,无web界面管理添加主机,数据无存档
2. cacti,优势:以snmp为主要取数工具,取得数据后存入rra文件 以rrdtools展现监控数据,相对添加主机和性能趋势分析有比较大优势
劣势:报警的及时性有所欠缺
3. zabbix,优势:分布式服务器监控,可以对多机房统一监控,一个局域网配置一台proxy代理主机收集数据汇总给监控主机,支持snmp zabbix_agentd等多种方式监控,对自定义数据收集比cacti脚本简单,有设备报备功能等等,功能十分强大适合大型分布式架构
劣势:相对来说占用资源较高,数据以mysql数据库存储为主,graph显示较慢(可能是因为数据量太大,没有cacti那么流畅)
55. 配置部署自动化: puppet(收费)、salt(python,免费)、 ansible
56. 系统安装自动化: kickstart(鸟哥教程、pxe/安装系统/ Windows Deployment Services) /cobbler/
58. 具备网络监控和资产管理,zabbix开源解决方案最合适不过了。比较完整的监控项,可定制化较强。导入导出监控配置模版,上手了就离不开它。
涉及运维自动化的话有:
1 系统安装自动化:kickstart,cobbler等
2 配置部署自动化:puppet,saltstack,ansible等
3 监控自动化 nagios,ganglia,cacti等
以上都是开源运维常用工具。像bat的sa们都自己开发定制运维系统了。
系统监控是作为网站运维、网站性能优化必不可少的工具,目前比较常用的有Nagios、Cacti以及Zabbix,笔者用过后两个,其中Zabbix确实很强大,web界面操作也比较不错。不过这几个工具安装起来那可并不简单,其中Nagios的复杂那可是出了名的。
59. 我比较看好zabbix这款监控软件,理由如下:
1.分布式监控,天生具有的功能,适合于构建分布式监控系统,具有node,proxy2种分布式模式
2.自动化功能,自动发现,自动注册主机,自动添加模板,自动添加分组,是天生的自动化运维利器的首选,当然于自动化运维工具搭配,puppet+zabbix,或者saltstack+zabbix,那是如鱼得水。
3.自定义监控比较方便,自定义监控项非常简单,支持变量,支持low level discovery,可以参考我写的文档自动化运维之监控篇---利用zabbix自动发现功能实现批量web url监控
4.触发器,也就是报警条件有多重判断机制,当然,这个需要你去研究一下,这也是zabbix的精华之处,
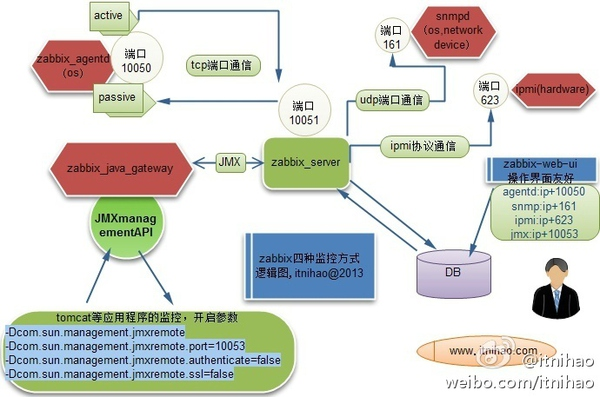
5.支持多种监控方式,agentd,snmp,ipmi,jmx,逻辑图如下
60. mysql benchmark performance test .:
1. mysql cluster可以用: flexAsynch
2. MySQLTuner
3. tuning-primer
4. mycheckpoint
作者:
fandyst
出处: http://www.cnblogs.com/todototry/
关注语言: python、javascript(node.js)、objective-C、java、R、C++
兴趣点: 互联网、大数据技术、大数据IO瓶颈、col-oriented DB、Key-Value DB、数据挖掘、模式识别、deep learning、开发与成本管理
产品:
本文版权归作者和博客园共有,欢迎转载,但未经作者同意必须保留此段声明,且在文章页面明显位置给出原文连接。
出处: http://www.cnblogs.com/todototry/
关注语言: python、javascript(node.js)、objective-C、java、R、C++
兴趣点: 互联网、大数据技术、大数据IO瓶颈、col-oriented DB、Key-Value DB、数据挖掘、模式识别、deep learning、开发与成本管理
产品:
本文版权归作者和博客园共有,欢迎转载,但未经作者同意必须保留此段声明,且在文章页面明显位置给出原文连接。

