ELK实践(二):收集Nginx日志
Nginx访问日志
这里补充下Nginx访问日志使用的说明。一般在nginx.conf主配置文件里需要定义一种格式:
log_format  main  '$remote_addr - $remote_user [$time_local] "$request" '
    '$status $body_bytes_sent "$http_referer" '
    '"$http_user_agent" "$http_x_forwarded_for" $request_time';
上面的格式我是基于默认的加了一个$request_time。
然后子配置使用:
access_log logs/myapp.log main;
即可。
Filebeat采集日志数据到ElasticSearch
配置:
su -e elk
cd /usr/local/elk
vim beats/filebeat/filebeat.test_nginx.yml
配置详情:
filebeat.prospectors:
- type: log
  input_type: log
  paths:
    - /work/yphp/nginx/logs/*.log
  tags: ["ngx", "yujc"]
  fields:
    logIndex: nginx
    docType: nginx-access
  fields_under_root: true
  tail_files: false

output.elasticsearch:
  hosts: ["127.0.0.1:9200"]
  index: "test-nginx-%{+yyyy.MM.dd}"
配置说明:
filebeat.prospectors:
- type 日志类型,默认log
- input_type 输入类型,默认log
- paths 采集的日志,可以使用通配符。支持多个
- tags 自定义标签,是个数组。自定义
- fields 自定义字段
- fields_under_root 自定义字段是否追加到根。如果为false,fields配置的字段键名是fields
- tail_files 是否从末尾开始采集
- document_type 自定义字段,用于Logsatsh区分来源,在Logsatsh里用变量
type表示
output.elasticsearch:
- hosts 配置ES节点,数组格式,支持多个。
- index 配置ES索引。不配置使用默认的 filebeat-*
- protocol 配置协议,例如http,https
- username 配置ES用户名,例如elastic
- password 配置ES密码,例如changeme
设置权限600,并启动filebeat:
chmod -R 600 beats/filebeat/filebeat.test_nginx.yml

./beats/filebeat/filebeat -c beats/filebeat/filebeat.test_nginx.yml
然后访问Nginx应用,查看ES是否新增了一个索引:
$ curl http://127.0.0.1:9200/_cat/indices?v | grep test-nginx
  % Total    % Received % Xferd  Average Speed   Time    Time     Time  Current
                                 Dload  Upload   Total   Spent    Left  Speed
105  1161  105  1161    0     0   123k      0 --:--:-- --:--:-- --:--:--  125k
yellow open   test-nginx-2018.09.24             ArxrVVOkTjG8ZlXJjb9bVg   5   1          1            0     11.6kb         11.6kb
我们查看一条数据:
$ curl http://127.0.0.1:9200/test-nginx-2018.09.24/_search?q=*&size=1


{
  "_index": "test-nginx-2018.09.24",
  "_type": "doc",
  "_id": "AWYKkBqtJzfnbYlB_DRX",
  "_version": 1,
  "_score": null,
  "_source": {
    "@timestamp": "2018-09-24T07:51:43.140Z",
    "beat": {
      "hostname": "2106567e5bce",
      "name": "2106567e5bce",
      "version": "5.6.2"
    },
    "docType": "nginx-access",
    "input_type": "log",
    "logIndex": "nginx",
    "message": "172.16.10.1 - - [24/Sep/2018:07:51:40 +0000] \"GET /?time=22 HTTP/1.1\" 200 97991 \"-\" \"Mozilla/5.0 (X11; Linux x86_64) AppleWebKit/537.36 (KHTML, like Gecko) Chrome/63.0.3239.132 Safari/537.36\" \"-\" 0.009",
    "offset": 5243,
    "source": "/work/yphp/nginx/logs/hello71.log",
    "tags": [
      "ngx",
      "yujc"
    ],
    "type": "log"
  },
  "fields": {
    "@timestamp": [
      1537775503140
    ]
  },
  "sort": [
    1537775503140
  ]
}
可以看到已经有数据了。但是日志内容作为一个整体(字段是message)了。
Filebeat采集日志数据,Logstash过滤发到ElasticSearch
配置:
su -e elk
cd /usr/local/elk
vim beats/filebeat/filebeat.test_nginx2.yml
配置详情:
filebeat.prospectors:
- type: log
  input_type: log
  paths:
    - /work/yphp/nginx/logs/*.log
  tags: ["ngx", "yujc"]
  fields:
    logIndex: nginx
    docType: nginx-access
  fields_under_root: true
  tail_files: false

output.logstash:
  hosts: ["127.0.0.1:5044"]
配置logstash
su -e elk
cd /usr/local/elk
vim logstash/config/conf.d/filebeat.conf
配置详情:
input {
    beats {
        port => 5044
    }
}

filter {
    grok {
        match => { "message" => "%{IPORHOST:remote_ip} - %{DATA:user_name} \[%{HTTPDATE:time}\] \"%{WORD:method} %{DATA:url} HTTP/%{NUMBER:http_version}\" %{NUMBER:response_code} %{NUMBER:body_sent:bytes} \"%{DATA:referrer}\" \"%{DATA:agent}\" \"%{DATA:x_forwarded_for}\" %{NUMBER:request_time}" }
        remove_field => "message"
    }
}

output {
    elasticsearch {
        hosts => ["127.0.0.1:9200"]
        index => "test-nginx2-%{type}-%{+YYYY.MM.dd}"
        document_type => "%{type}"
    }
    stdout { codec => rubydebug }
}
我使用的nginx日志格式是在标准格式后面加了2个字段$http_x_forwarded_for和$request_time:
log_format  main  '$remote_addr - $remote_user [$time_local] "$request" '
'$status $body_bytes_sent "$http_referer" '
'"$http_user_agent" "$http_x_forwarded_for" $request_time';
日志示例:
172.16.10.1 - - [24/Sep/2018:09:04:40 +0000] "GET /?time=2244 HTTP/1.1" 200 98086 "-" "Mozilla/5.0 (X11; Linux x86_64) AppleWebKit/537.36 (KHTML, like Gecko) Chrome/63.0.3239.132 Safari/537.36" "-" 0.002
上面的grok表达式是:
%{IPORHOST:remote_ip} - %{DATA:user_name} \[%{HTTPDATE:time}\] \"%{WORD:method} %{DATA:url} HTTP/%{NUMBER:http_version}\" %{NUMBER:response_code} %{NUMBER:body_sent:bytes} \"%{DATA:referrer}\" \"%{DATA:agent}\" \"%{DATA:x_forwarded_for}\" %{NUMBER:request_time}
我们先使用Grok Debugger 工具在线调试下,看看写的grok是否正确。我之前没有测试之前启动,发现ES里没有grok里解析出来的字段,后来在命令行看到filebeat的输出(前台运行):
$ ./beats/filebeat/filebeat -c beats/filebeat/filebeat.test_nginx2.yml

{
    "@timestamp" => 2018-09-24T09:01:19.555Z,
      "logIndex" => "nginx",
        "offset" => 6467,
       "docType" => "nginx-access",
      "@version" => "1",
    "input_type" => "log",
          "beat" => {
            "name" => "2106567e5bce",
        "hostname" => "2106567e5bce",
         "version" => "5.6.2"
    },
          "host" => "2106567e5bce",
        "source" => "/work/yphp/nginx/logs/hello71.log",
       "message" => "172.16.10.1 - - [24/Sep/2018:09:01:14 +0000] \"GET /?time=2244 HTTP/1.1\" 200 98087 \"-\" \"Mozilla/5.0 (X11; Linux x86_64) AppleWebKit/537.36 (KHTML, like Gecko) Chrome/63.0.3239.132 Safari/537.36\" \"-\" 0.195",
          "type" => "log",
          "tags" => [
        [0] "ngx",
        [1] "yujc",
        [2] "beats_input_codec_plain_applied",
        [3] "_grokparsefailure"
    ]
}
最后面提示了_grokparsefailure,说明grok部分写的有问题。由于是参考的网上教程,也加上刚接触,不知道怎么配置,filebeat.conf调试了很久才生效。
我们打开Grok Debugger,第一个输入框输入filebeat采集的消息原文message字段里的内容,第二个输入框输入grok表达式:
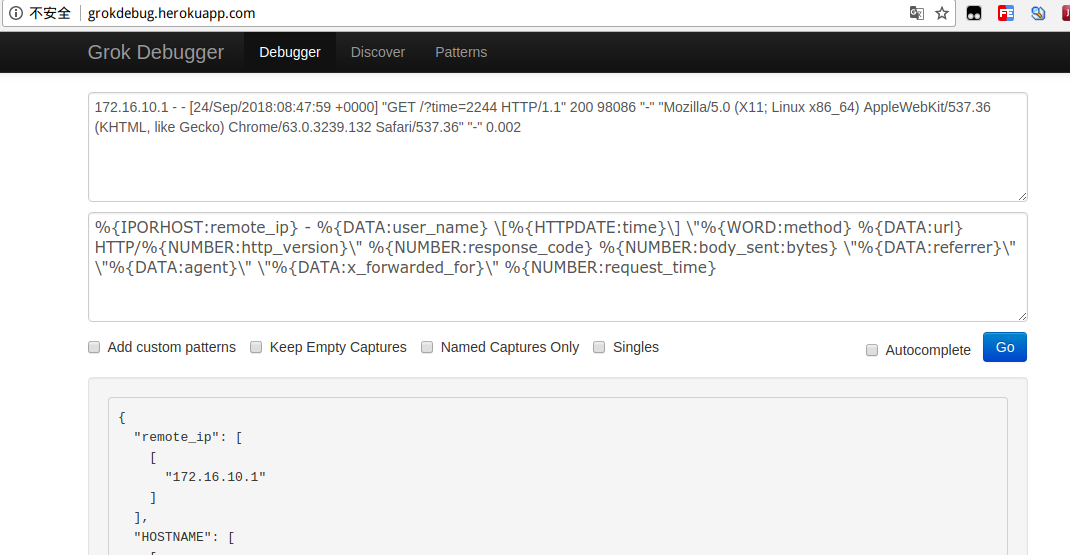
点击Go按钮即可解析。如果下面的内容是{}说明解析失败,然后可以修改表达式,该工具会自动解析。最终解析结果:
{
  "remote_ip": [
    [
      "172.16.10.1"
    ]
  ],
  "HOSTNAME": [
    [
      "172.16.10.1"
    ]
  ],
  "IP": [
    [
      null
    ]
  ],
  "IPV6": [
    [
      null
    ]
  ],
  "IPV4": [
    [
      null
    ]
  ],
  "user_name": [
    [
      "-"
    ]
  ],
  "time": [
    [
      "24/Sep/2018:08:47:59 +0000"
    ]
  ],
  "MONTHDAY": [
    [
      "24"
    ]
  ],
  "MONTH": [
    [
      "Sep"
    ]
  ],
  "YEAR": [
    [
      "2018"
    ]
  ],
  "TIME": [
    [
      "08:47:59"
    ]
  ],
  "HOUR": [
    [
      "08"
    ]
  ],
  "MINUTE": [
    [
      "47"
    ]
  ],
  "SECOND": [
    [
      "59"
    ]
  ],
  "INT": [
    [
      "+0000"
    ]
  ],
  "method": [
    [
      "GET"
    ]
  ],
  "url": [
    [
      "/?time=2244"
    ]
  ],
  "http_version": [
    [
      "1.1"
    ]
  ],
  "BASE10NUM": [
    [
      "1.1",
      "200",
      "98086",
      "0.002"
    ]
  ],
  "response_code": [
    [
      "200"
    ]
  ],
  "body_sent": [
    [
      "98086"
    ]
  ],
  "referrer": [
    [
      "-"
    ]
  ],
  "agent": [
    [
      "Mozilla/5.0 (X11; Linux x86_64) AppleWebKit/537.36 (KHTML, like Gecko) Chrome/63.0.3239.132 Safari/537.36"
    ]
  ],
  "x_forwarded_for": [
    [
      "-"
    ]
  ],
  "request_time": [
    [
      "0.002"
    ]
  ]
}
然后可以启动logstash了。
测试logstash配置是否通过:
./logstash/bin/logstash -f logstash/config/conf.d/filebeat.conf --config.test_and_exit

Config Validation Result: OK. Exiting Logstash
# 启动logstash
./logstash/bin/logstash &

# 启动filebeat
./beats/filebeat/filebeat -c beats/filebeat/filebeat.test_nginx2.yml
我们再次访问Nginx应用,然后我们查看一条数据:
$ curl http://127.0.0.1:9200/test-nginx2-log-2018.09.24/_search?q=*&size=1&sort=@timestamp:desc

{
  "took": 14,
  "timed_out": false,
  "_shards": {
    "total": 5,
    "successful": 5,
    "skipped": 0,
    "failed": 0
  },
  "hits": {
    "total": 3,
    "max_score": null,
    "hits": [
      {
        "_index": "test-nginx2-log-2018.09.24",
        "_type": "log",
        "_id": "AWYK0to8JzfnbYlB_DRx",
        "_score": null,
        "_source": {
          "response_code": "200",
          "agent": "Mozilla/5.0 (X11; Linux x86_64) AppleWebKit/537.36 (KHTML, like Gecko) Chrome/63.0.3239.132 Safari/537.36",
          "logIndex": "nginx",
          "offset": 6875,
          "method": "GET",
          "docType": "nginx-access",
          "user_name": "-",
          "input_type": "log",
          "http_version": "1.1",
          "source": "/work/yphp/nginx/logs/hello71.log",
          "message": """172.16.10.1 - - [24/Sep/2018:09:04:40 +0000] "GET /?time=2244 HTTP/1.1" 200 98086 "-" "Mozilla/5.0 (X11; Linux x86_64) AppleWebKit/537.36 (KHTML, like Gecko) Chrome/63.0.3239.132 Safari/537.36" "-" 0.002""",
          "type": "log",
          "url": "/?time=2244",
          "tags": [
            "ngx",
            "yujc",
            "beats_input_codec_plain_applied"
          ],
          "x_forwarded_for": "-",
          "referrer": "-",
          "@timestamp": "2018-09-24T09:04:40.404Z",
          "remote_ip": "172.16.10.1",
          "request_time": "0.002",
          "@version": "1",
          "beat": {
            "name": "2106567e5bce",
            "hostname": "2106567e5bce",
            "version": "5.6.2"
          },
          "host": "2106567e5bce",
          "body_sent": "98086",
          "time": "24/Sep/2018:09:04:40 +0000"
        },
        "sort": [
          1537779880404
        ]
      }
    ]
  }
}
里面就包含了所有我们解析出来的字段。
kibana里查看
打开kibana web地址:http://127.0.0.1:5601,依次打开:Management
-> Kibana -> Index Patterns ,选择Create Index Pattern:
a. Index pattern 输入:test-nginx2-* ;
b. Time Filter field name 选择 @timestamp。
c. 点击Create。
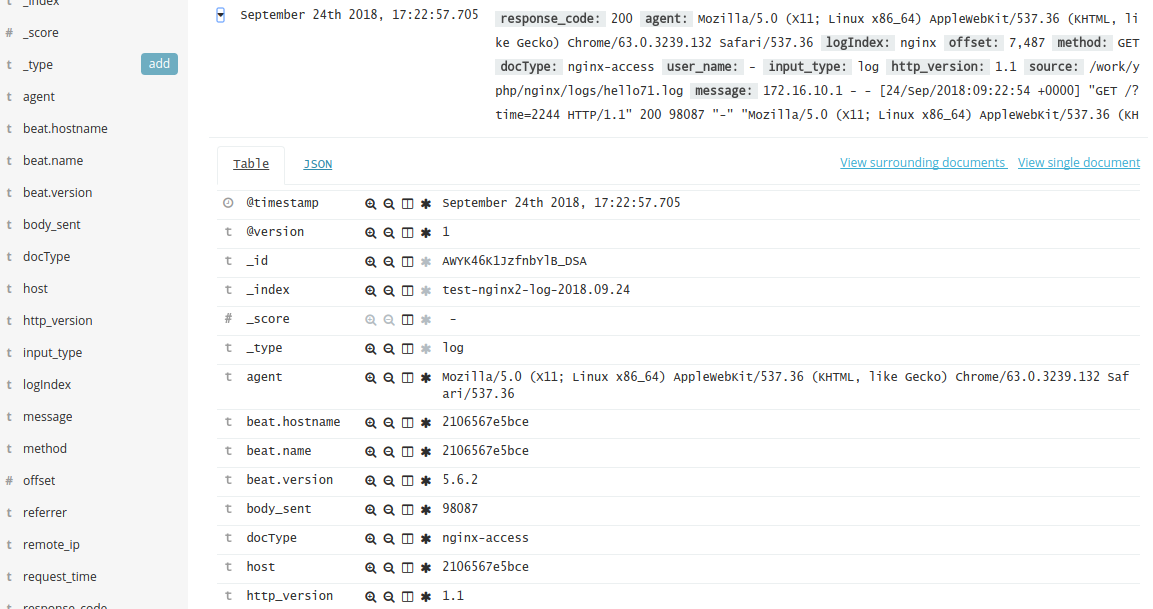
然后打开Discover,选择 filebeat-* 就能看到日志数据了。
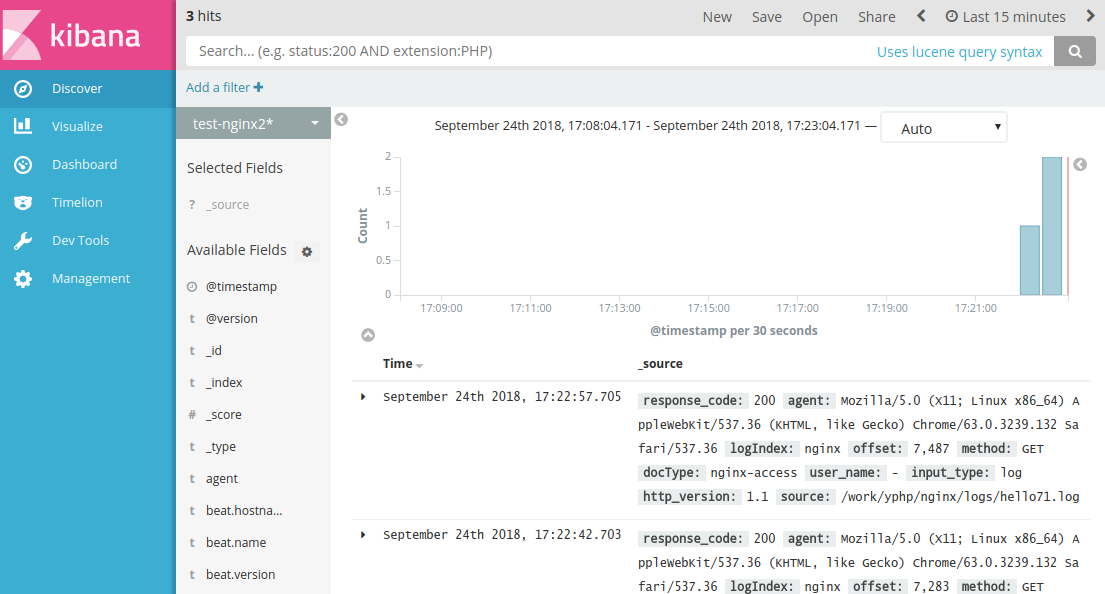
可以看到详细字段:
参考
1、Logstash使用grok过滤nginx日志(二) - Orgliny - 博客园
https://www.cnblogs.com/Orgliny/p/5592186.html
2、Rsyslog日志服务搭建 - K‘e0llm - 博客园
http://www.cnblogs.com/Eivll0m/p/6700828.html
3、Logstash中如何处理到ElasticSearch的数据映射 - Cocowool - 博客园
https://www.cnblogs.com/cocowool/p/7347069.html
4、ELK 架构之 Logstash 和 Filebeat 安装配置 - 田园里的蟋蟀 - 博客园
http://www.cnblogs.com/xishuai/p/elk-logstash-filebeat.html
5、搭建ELK日志分析平台(下)—— 搭建kibana和logstash服务器-zero菌-51CTO博客
http://blog.51cto.com/zero01/2082794
本文优先在公众号"飞鸿影的博客(fhyblog)"发布,欢迎关注公众号及时获取最新文章推送!

作者:飞鸿影
出处:http://52fhy.cnblogs.com/
版权申明:没有标明转载或特殊申明均为作者原创。本文采用以下协议进行授权,自由转载 - 非商用 - 非衍生 - 保持署名 | Creative Commons BY-NC-ND 3.0,转载请注明作者及出处。